Answered step by step
Verified Expert Solution
Question
1 Approved Answer
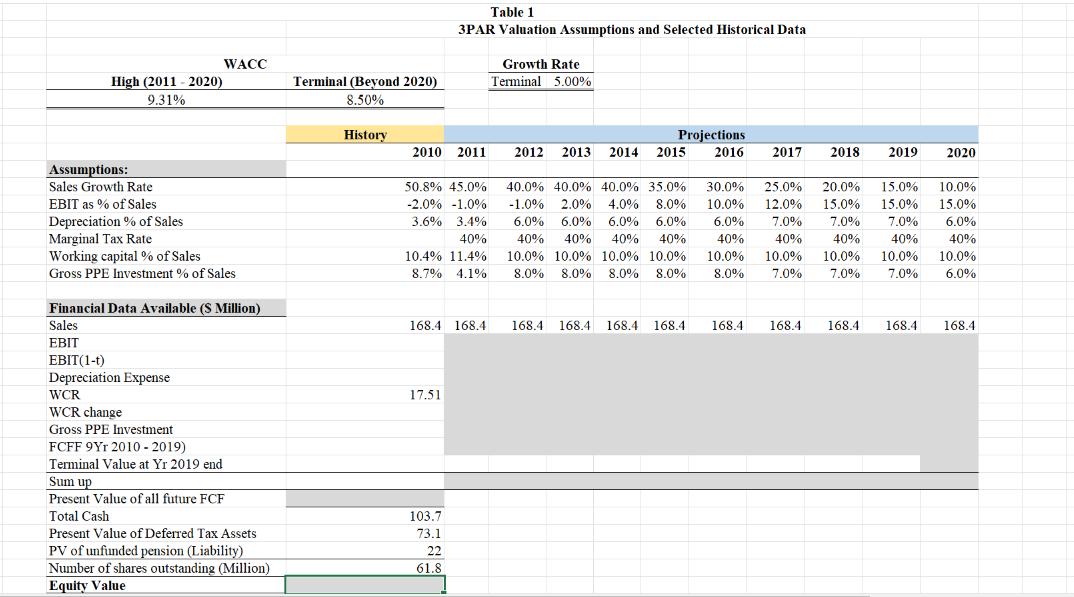
In Sep 2010, HP acquired 3PAR. Table 1 provides selected financial data on 3PAR and a set of valuation assumptions. The 10 year forecasting


In Sep 2010, HP acquired 3PAR. Table 1 provides selected financial data on 3PAR and a set of valuation assumptions. The 10 year forecasting period (2011-2020) and continued 3PAR high sales-growth rate reflect the HP expectation that its extensive global sales force can expand the sale of 3PAR products. To support further development of the 3PAR products, the valuation assumptions reflect an increase in plant and equipment spending in excess of depreciation and amortization through 2016; however, beyond 2016, capital spending is expected to grow at the same rate as depreciation as the business moves from a growth mode to a maintenance mode. 3PAR's operating margin is expected to show a slow recovery, reflecting the impact of escalating marketing expenses and the cost of training the HP sales force in the promotion of the 3PAR technology. What is the fair equity value of 3PAR per share as of end of 2010, based on the forecasting in Table 1 Equity Value High (2011-2020) 9.31% Assumptions: Sales Growth Rate EBIT as % of Sales Depreciation % of Sales Marginal Tax Rate Working capital % of Sales Gross PPE Investment % of Sales WACC Financial Data Available (S Million) Sales EBIT EBIT(1-t) Depreciation Expense WCR WCR change Gross PPE Investment FCFF 9Yr 2010-2019) Terminal Value at Yr 2019 end Sum up Present Value of all future FCF Total Cash Present Value of Deferred Tax Assets PV of unfunded pension (Liability) Number of shares outstanding (Million) Equity Value Terminal (Beyond 2020) 8.50% History 2010 2011 Table 1 3PAR Valuation Assumptions and Selected Historical Data 50.8% 45.0% -2.0% -1.0 % 3.6% 3.4% 40% 10.4% 11.4% 8.7% 4,1% 168.4 168.4 17.51 103.7 73.1 22 61.8 Growth Rate Terminal 5.00% Projections 2016 2012 2013 2014 2015 40.0% 40.0% 40.0% 35.0% -1.0% 2.0% 4.0% 8.0% 6.0% 6.0% 6.0% 6.0% 40% 40% 40% 40% 10.0% 10.0 % 10.0 % 10.0% 8.0% 8.0% 8.0% 8.0% 168.4 168.4 168.4 168.4 2017 168.4 2018 2019 10.0% 15.0% 30.0% 25.0% 20.0% 15.0% 10.0% 12.0% 15.0% 15.0% 6.0% 7.0% 7.0% 7.0% 6.0% 40% 40% 40% 40% 40% 10.0% 10.0% 10.0% 10.0% 10.0% 8.0% 7.0% 7,0% 7.0% 6.0% 2020 168.4 168.4 168.4 168.4
Step by Step Solution
★★★★★
3.28 Rating (160 Votes )
There are 3 Steps involved in it
Step: 1
SOLUTION To calculate the fair equity value of 3PAR per share as of the end of 2010 we need to perfo...
Get Instant Access to Expert-Tailored Solutions
See step-by-step solutions with expert insights and AI powered tools for academic success
Step: 2

Step: 3

Ace Your Homework with AI
Get the answers you need in no time with our AI-driven, step-by-step assistance
Get Started


