Answered step by step
Verified Expert Solution
Link Copied!

Question

1 Approved Answer

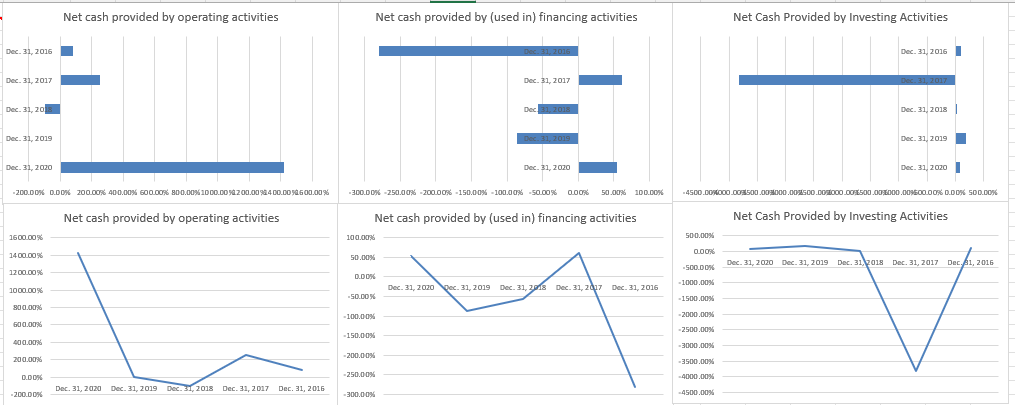
In terms of Horizontal Analysis, describe these graphs from in IS? Net cash provided by operating activities Net cash provided by (used in) financing activities

In terms of Horizontal Analysis, describe these graphs from in IS?

image text in transcribed

Net cash provided by operating activities Net cash provided by (used in) financing activities Net Cash Provided by Investing Activities Dec 31, 2016 Dec 31, 2016 Dec 31, 2017 Dec 31, 2017 11. 2017 Dec 31, 20 Dec 31, 2018 Dec 31, 2018 1 Dec 31, 2019 Dec 31, 2019 Dec 31, 2019 Dec 31, 2020 Dec 31, 2020 Dec 31, 2020 1 -200.00% 0.0% 200.00% 400.00% 600.00% 800.00% 1000.00 8.200.000 400.000 600.00% - 300.00% -250.00% -200.00% -150.00%-100.00% -50.00% 0.00% 50.00% 100.00% .4500.00000.00 500.003000.00 500.000.000.00.500.00000.00 500.00% D.D0% SOD.00% Net cash provided by operating activities Net cash provided by (used in) financing activities Net Cash Provided by Investing Activities 1600.00% 100.00 500.00% 0.00 1400.00% 50.00% Dec 31, 2020 Dec 31, 2019 Dec 31, 2018 Dec 31, 2017 Dec. 31, 2016 -500DOX 1200.00% D.DK -1000.00% 1000.00% Dec 31, 2020 Dec 31, 2019 Dec 31, 2018 Dec 31, 2017 Dec 31, 2016 , -50.00% -1500.00% 300.00% -100.00% -2000.00% 600.00 -2500.00% -150.00% 400.00 -3000.00% 200.00 -200.00% -3500.00% -4000.00% D.DDY -250.00% Dec 31, 2020 Dec 31, 2019 Dec 31, 2018 Dec 31, 2017 Dec 31, 2016 , 200.00 -300.00% -4500.00%

Step by Step Solution

There are 3 Steps involved in it

Step: 1

blur-text-image

Get Instant Access to Expert-Tailored Solutions

See step-by-step solutions with expert insights and AI powered tools for academic success

Step: 2

blur-text-image

Step: 3

blur-text-image

Ace Your Homework with AI

Get the answers you need in no time with our AI-driven, step-by-step assistance

Get Started

Recommended Textbook for

More Books

Students also viewed these Finance questions