

Question
In the course of this exercise sheet, you are presented with the dataset Galaxy radial velocity. The data frame records the radial velocity of a
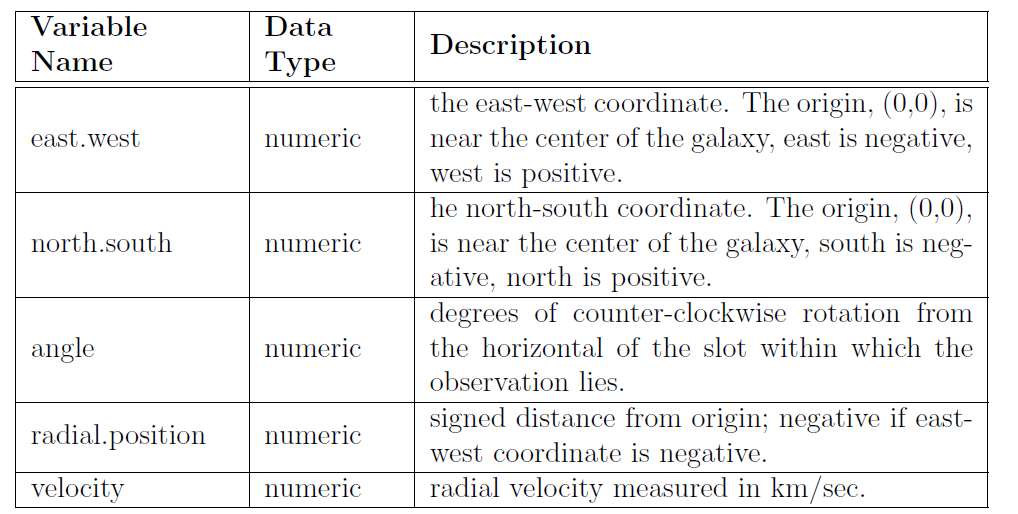
In the course of this exercise sheet, you are presented with the dataset Galaxy radial velocity. The data frame records the radial velocity of a spiral galaxy measured at 323 points in the area of sky which it covers. All the measurements lie within seven slots crossing at the origin. This dataset is composed of 323 observations presented in rows and 5 variables presented in columns. The variables are defined as follows:
Dataset available at this link: https://drive.google.com/file/d/1A8bjrYYz7gFHyvU0vXw8CHHX5tonfoNq/view?usp=share_link
Exploratory Data Analysis Give an overview of the dataset by means of visualization methods and descriptive statistics. (a) Describe the dataset and specify the characteristics of each variable. Use both descriptive statistics as well as visualization techniques in order to present the data. (b) Investigate whether there is noticeable correlation between covariates and discuss how the result may influence your following analysis. You could use a heat map or pair plot to illustrate the pairwise relationships between variables. (c) Which explanatory variables are likely to affect the response variable? Answer this question before estimating a model.
Building a Model Based on the considerations above, you now have to choose an appropriate method for prediction. (a) Divide your dataset into training and testing sets using the ratio 85 : 15. (b) Choose an appropriate model for the given data from among the models you learned in the lecture. Provide an explanation of why this method is suitable for the task. (c) For your chosen method, estimate the model based on the training set. Then evaluate the performance of the model based on both test and training sets. (d) Finally, interpret the estimated model and judge its performance critically.
\begin{tabular}{|l|l|l|} \hline Variable Name & Data Type & Description \\ \hline \hline east.west & numeric & the east-west coordinate. The origin, (0,0), is near the center of the galaxy, east is negative, west is positive. \\ \hline north.south & numeric & he north-south coordinate. The origin, (0,0), is near the center of the galaxy, south is negative, north is positive. \\ \hline angle & numeric & degrees of counter-clockwise rotation from the horizontal of the slot within which the observation lies. \\ \hline radial.position & numeric & signed distance from origin; negative if eastwest coordinate is negative. \\ \hline velocity & numeric & radial velocity measured in km/sec. \\ \hline \end{tabular}Step by Step Solution
There are 3 Steps involved in it
Step: 1

Get Instant Access to Expert-Tailored Solutions
See step-by-step solutions with expert insights and AI powered tools for academic success
Step: 2

Step: 3
Ace Your Homework with AI
Get the answers you need in no time with our AI-driven, step-by-step assistance
Get Started
Mysql Examples Explanations Explain Examples
Authors: Harry Baker ,Ray Yao
1st Edition
B0CQK9RN2J, 979-8872176237