Answered step by step
Verified Expert Solution
Question
1 Approved Answer
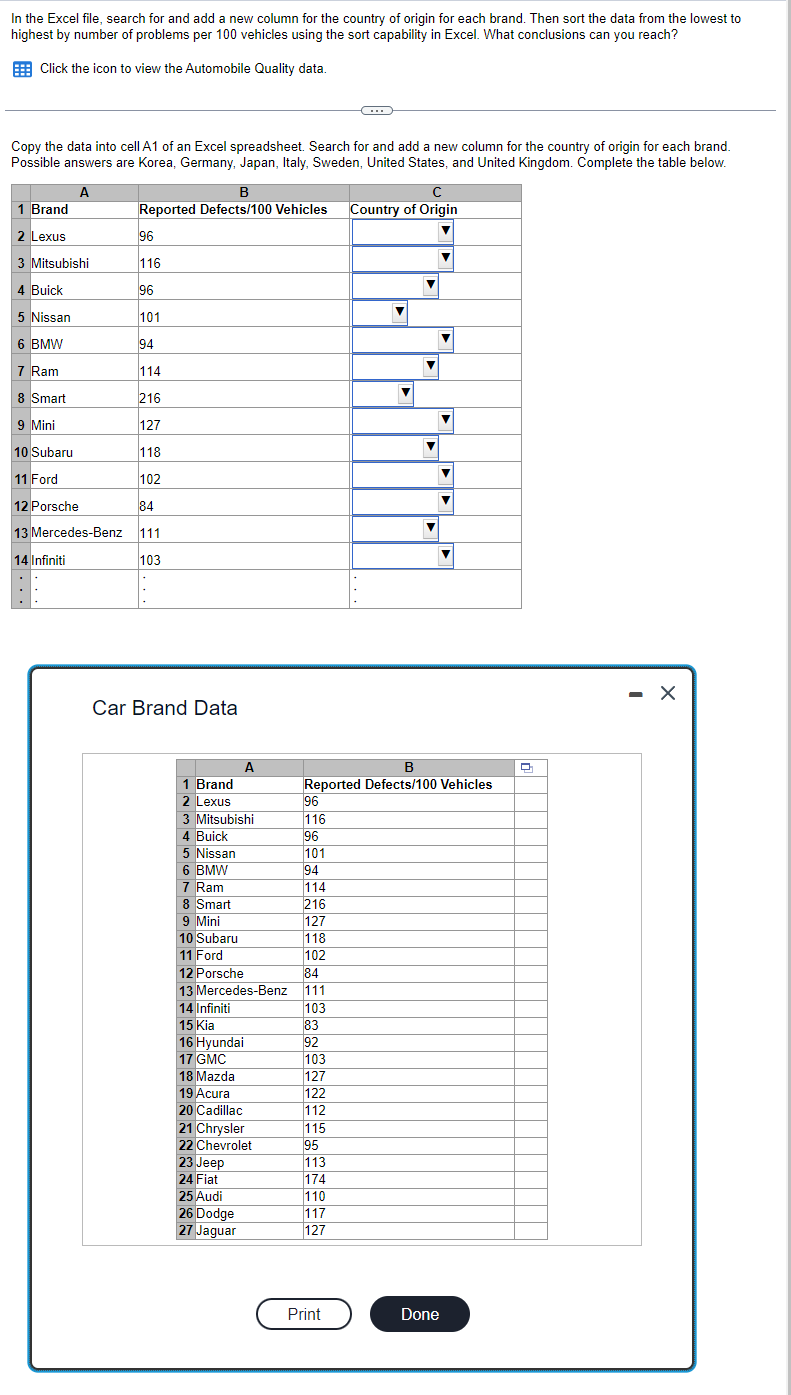
In the Excel file, search for and add a new column for the country of origin for each brand. Then sort the data from

In the Excel file, search for and add a new column for the country of origin for each brand. Then sort the data from the lowest to highest by number of problems per 100 vehicles using the sort capability in Excel. What conclusions can you reach? Click the icon to view the Automobile Quality data. Copy the data into cell A1 of an Excel spreadsheet. Search for and add a new column for the country of origin for each brand. Possible answers are Korea, Germany, Japan, Italy, Sweden, United States, and United Kingdom. Complete the table below. A B Reported Defects/100 Vehicles Country of Origin 1 Brand 2 Lexus 96 3 Mitsubishi 116 4 Buick 96 5 Nissan 101 6 BMW 94 7 Ram 114 8 Smart 216 9 Mini 127 10 Subaru 118 11 Ford 102 12 Porsche 84 13 Mercedes-Benz 111 14 Infiniti 103 Car Brand Data 1 Brand 2 Lexus A 3 Mitsubishi 4 Buick 5 Nissan 6 BMW 7 Ram 8 Smart 9 Mini 10 Subaru 11 Ford 12 Porsche 13 Mercedes-Benz 14 Infiniti 15 Kia 16 Hyundai 17 GMC 18 Mazda 19 Acura 20 Cadillac 21 Chrysler 22 Chevrolet 23 Jeep 24 Fiat 25 Audi 26 Dodge 27 Jaguar 96 116 96 101 94 114 216 127 118 102 84 111 103 83 92 103 127 122 112 -C 115 95 113 174 110 117 127 Print B Reported Defects/100 Vehicles Done D - X
Step by Step Solution
★★★★★
3.54 Rating (157 Votes )
There are 3 Steps involved in it
Step: 1
Add the Country of Origin Column First you need to add the country of origin for each brand next to ...
Get Instant Access to Expert-Tailored Solutions
See step-by-step solutions with expert insights and AI powered tools for academic success
Step: 2

Step: 3

Ace Your Homework with AI
Get the answers you need in no time with our AI-driven, step-by-step assistance
Get Started


