

Question
In the given graph, the impact of an increased rate of money supply growth at time period 0 was shown. From the figure, one can
In the given graph, the impact of an increased rate of money supply growth at time period 0 was shown. From the figure, one can find out that
liquidity effect is less than the expected inflation effect and interest rates adjust quickly to changes in expected inflation. liquidity effect is more than the expected inflation effect and interest rates adjust slowly to changes in expected inflation. liquidity effect is more than the expected inflation effect and interest rates adjust quickly to changes in expected inflation. liquidity effect is less than the expected inflation effect and interest rates adjust slowly to changes in expected inflation.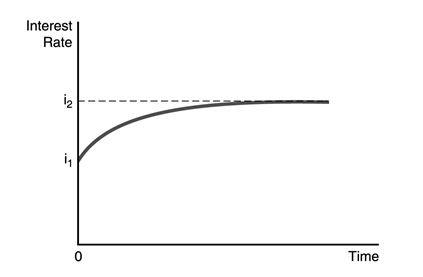
Step by Step Solution
There are 3 Steps involved in it
Step: 1

Get Instant Access to Expert-Tailored Solutions
See step-by-step solutions with expert insights and AI powered tools for academic success
Step: 2

Step: 3
Ace Your Homework with AI
Get the answers you need in no time with our AI-driven, step-by-step assistance
Get Started
Scientific Forecasting
Authors: Karl Karsten
1st Edition
1614278148, 978-1614278146