Answered step by step
Verified Expert Solution
Question
1 Approved Answer
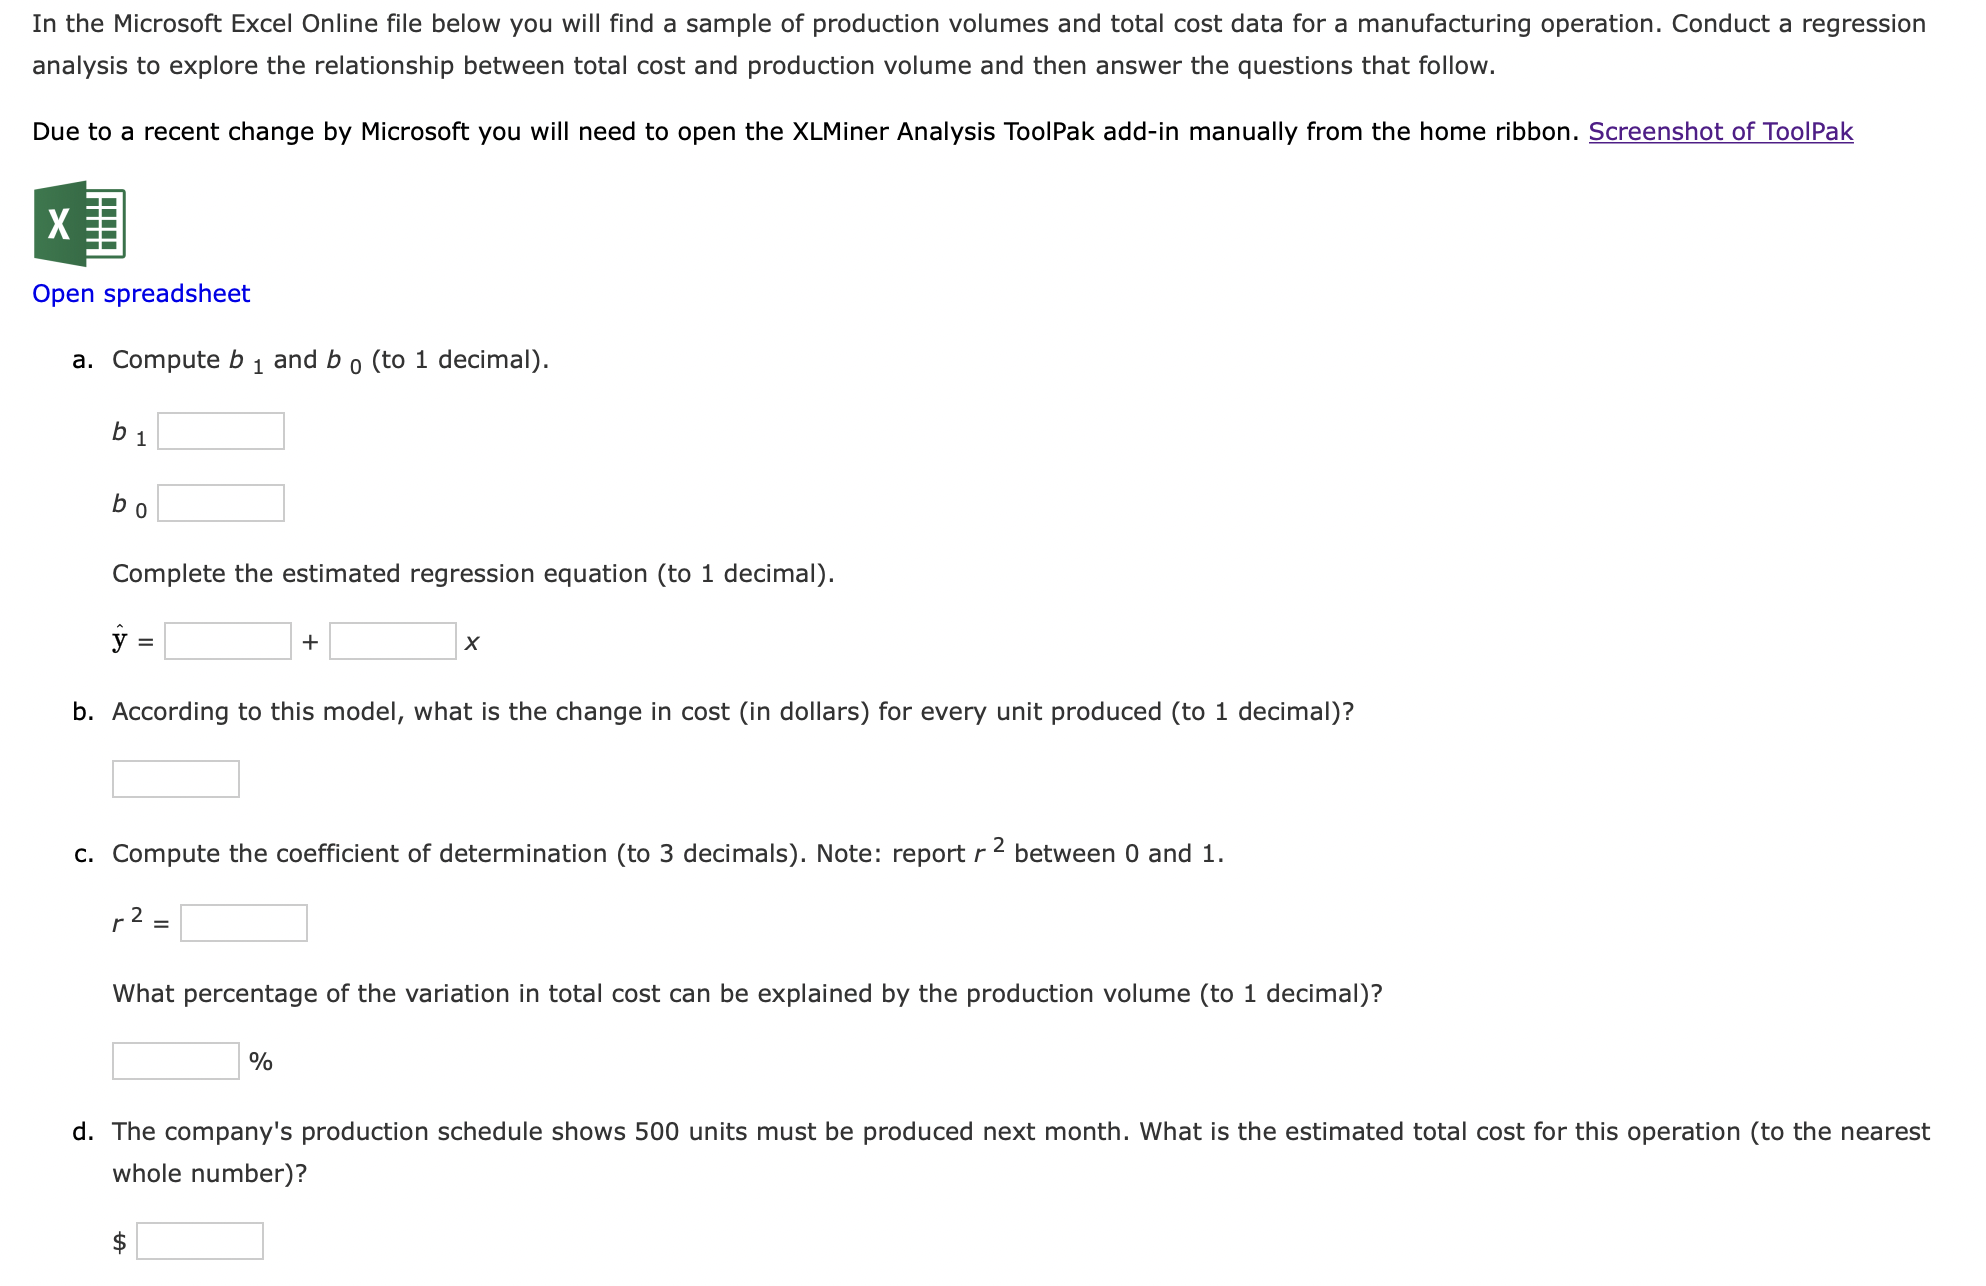
In the Microsoft Excel Online file below you will find a sample of production volumes and total cost data for a manufacturing operation. Conduct a

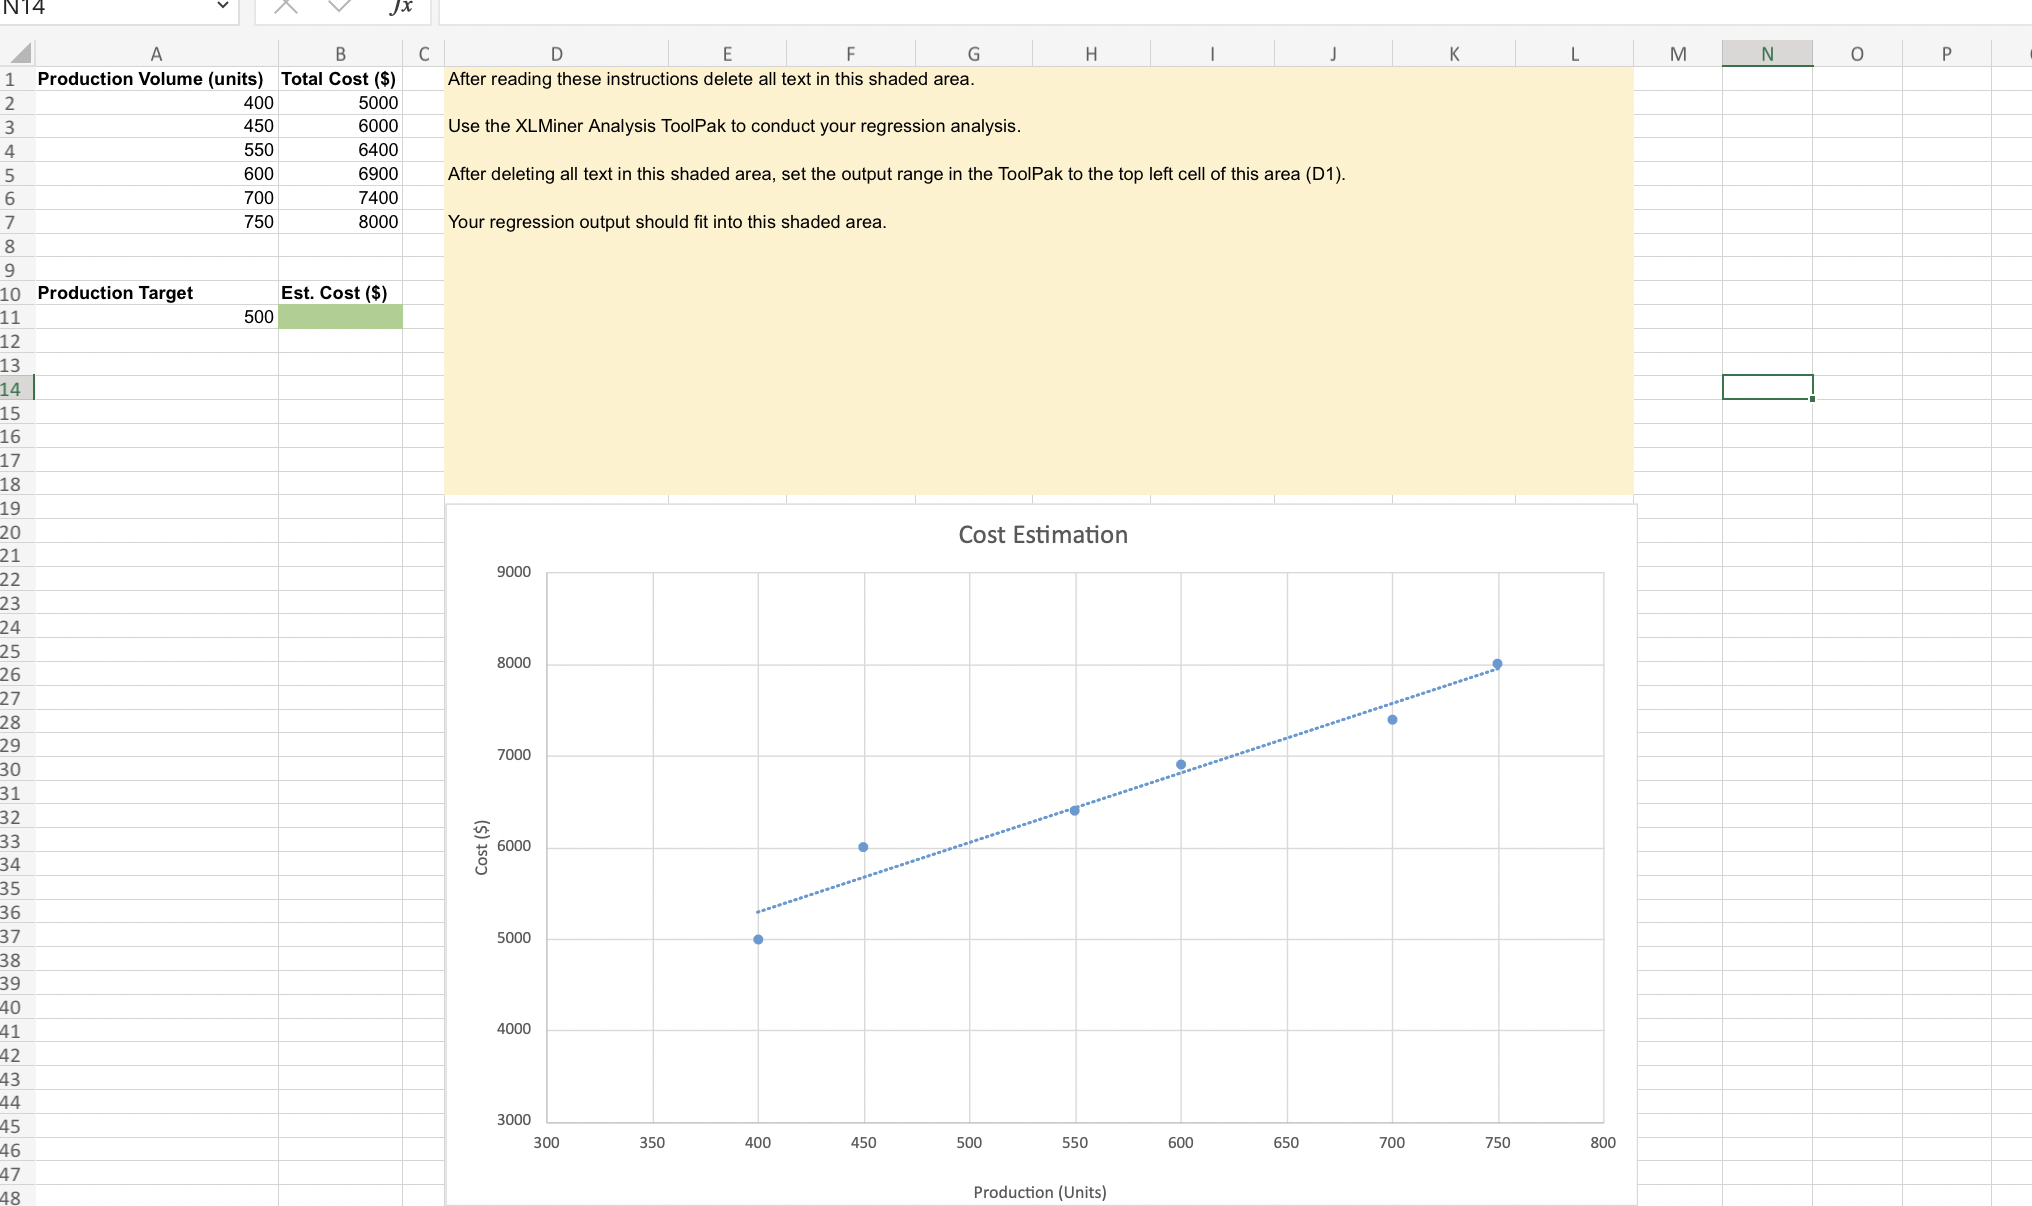
 In the Microsoft Excel Online file below you will find a sample of production volumes and total cost data for a manufacturing operation. Conduct a regression analysis to explore the relationship between total cost and production volume and then answer the questions that follow. Due to a recent change by Microsoft you will need to open the XLMiner Analysis ToolPak add-in manually from the home ribbon. Screenshot of ToolPak Open spreadsheet a. Compute b1 and b0 (to 1 decimal). b1 b0 Complete the estimated regression equation (to 1 decimal). y^=+x b. According to this model, what is the change in cost (in dollars) for every unit produced (to 1 decimal)? c. Compute the coefficient of determination (to 3 decimals). Note: report r2 between 0 and 1 . r2= What percentage of the variation in total cost can be explained by the production volume (to 1 decimal)? % d. The company's production schedule shows 500 units must be produced next month. What is the estimated total cost for this operation (to the nearest whole number)? $ ter reading these instructions delete all text in this shaded area. se the XLMiner Analysis ToolPak to conduct your regression analysis. ter deleting all text in this shaded area, set the output range in the ToolPak to the top left cell of this area (D1). ur regression output should fit into this shaded area
 Step by Step Solution
There are 3 Steps involved in it
Step: 1

Get Instant Access to Expert-Tailored Solutions
See step-by-step solutions with expert insights and AI powered tools for academic success
Step: 2

Step: 3

Ace Your Homework with AI
Get the answers you need in no time with our AI-driven, step-by-step assistance
Get Started


