

Answered step by step
Verified Expert Solution
Question
1 Approved Answer
In the portfolio optimization problem discussed in class, we minimized the portfolio's standard deviation subject to a constraint on the portfolio's expected return. Here
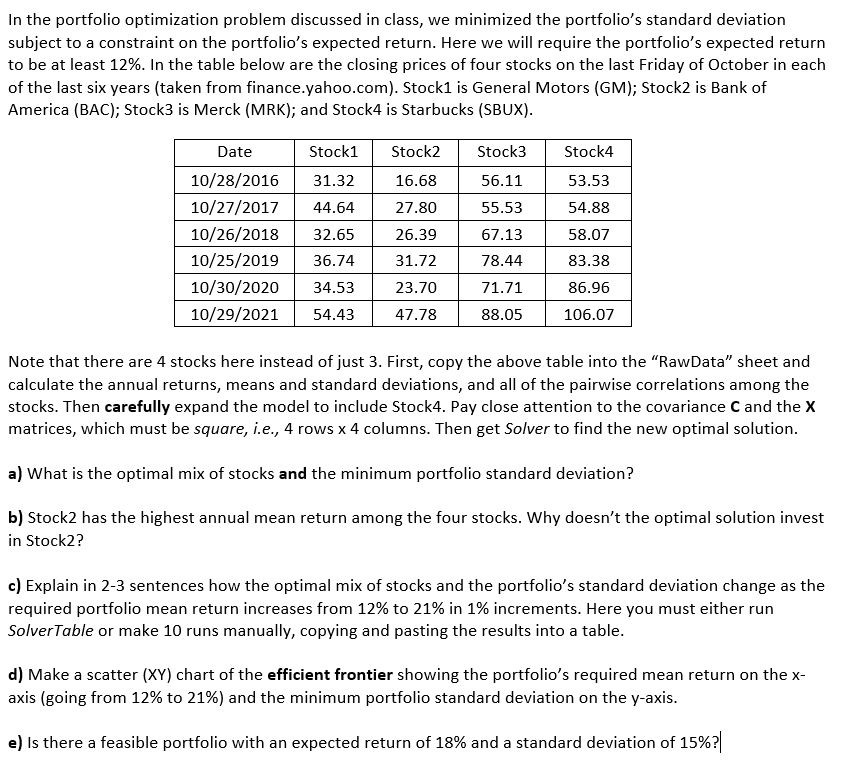
In the portfolio optimization problem discussed in class, we minimized the portfolio's standard deviation subject to a constraint on the portfolio's expected return. Here we will require the portfolio's expected return to be at least 12%. In the table below are the closing prices of four stocks on the last Friday of October in each of the last six years (taken from finance.yahoo.com). Stock1 is General Motors (GM); Stock2 is Bank of America (BAC); Stock3 is Merck (MRK); and Stock4 is Starbucks (SBUX). Date Stock1 Stock2 Stock3 Stock4 10/28/2016 31.32 16.68 56.11 53.53 10/27/2017 44.64 27.80 55.53 54.88 10/26/2018 32.65 26.39 67.13 58.07 10/25/2019 36.74 31.72 78.44 83.38 10/29/2021 10/30/2020 34.53 54.43 23.70 71.71 86.96 47.78 88.05 106.07 Note that there are 4 stocks here instead of just 3. First, copy the above table into the "RawData" sheet and calculate the annual returns, means and standard deviations, and all of the pairwise correlations among the stocks. Then carefully expand the model to include Stock4. Pay close attention to the covariance C and the X matrices, which must be square, i.e., 4 rows x 4 columns. Then get Solver to find the new optimal solution. a) What is the optimal mix of stocks and the minimum portfolio standard deviation? b) Stock2 has the highest annual mean return among the four stocks. Why doesn't the optimal solution invest in Stock2? c) Explain in 2-3 sentences how the optimal mix of stocks and the portfolio's standard deviation change as the required portfolio mean return increases from 12% to 21% in 1% increments. Here you must either run Solver Table or make 10 runs manually, copying and pasting the results into a table. d) Make a scatter (XY) chart of the efficient frontier showing the portfolio's required mean return on the x- axis (going from 12% to 21%) and the minimum portfolio standard deviation on the y-axis. e) Is there a feasible portfolio with an expected return of 18% and a standard deviation of 15%?|
Step by Step Solution
There are 3 Steps involved in it
Step: 1

Get Instant Access to Expert-Tailored Solutions
See step-by-step solutions with expert insights and AI powered tools for academic success
Step: 2

Step: 3
Ace Your Homework with AI
Get the answers you need in no time with our AI-driven, step-by-step assistance
Get Started
Core Concepts of Government and Not For Profit Accounting
Authors: Michael H. Granof, Penelope S. Wardlow
2nd edition
471737925, 978-0-470-4605, 978-0471737926