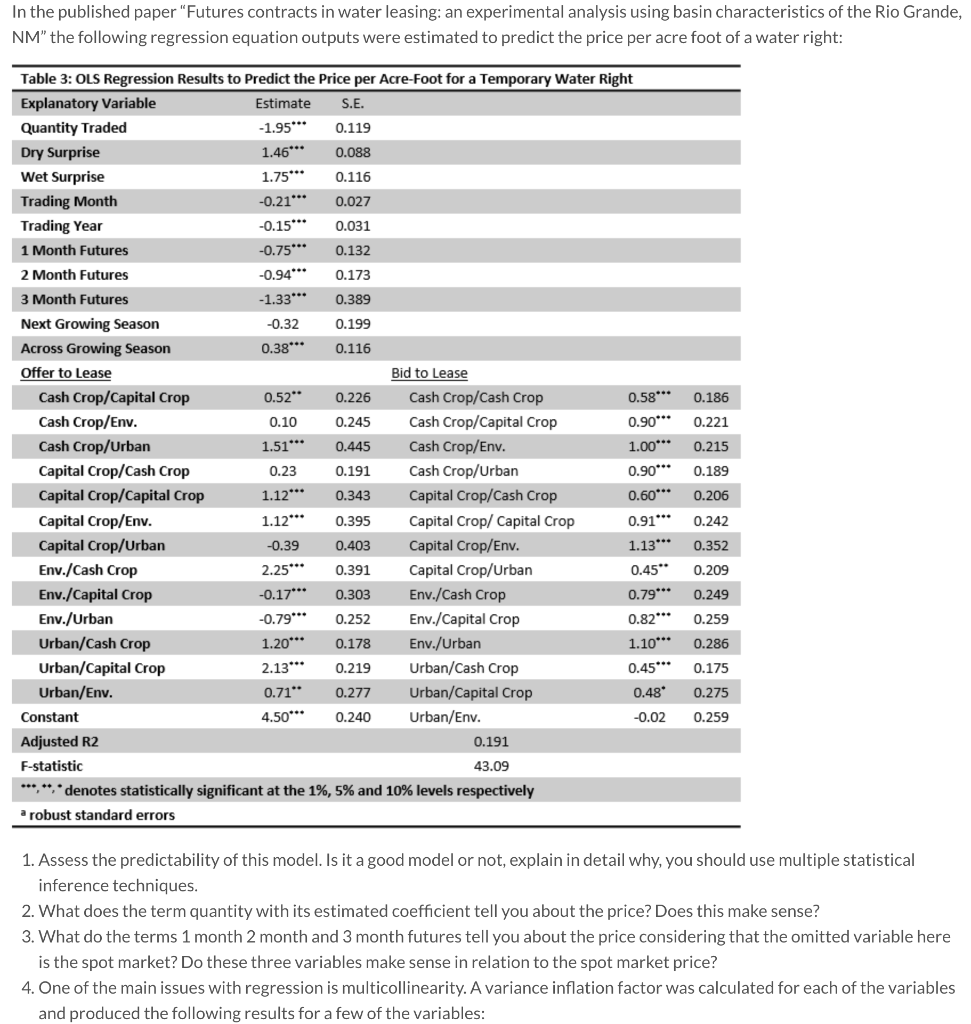
In the published paper "Futures contracts in water leasing: an experimental analysis using basin characteristics of the Rio Grande, NM" the following regression equation outputs were estimated to predict the price per acre foot of a water right Table 3: OLS Regression Results to Predict the Price per Acre-Foot for a Temporary Water Right Explanatory Variable Quantity Traded Estimate S.E. -1.95*** 0.119 Dry Surprise 1.46** 0.088 Wet Surprise 1.75** 0.116 -0.21** Trading Month 0.027 -0.15* Trading Year 0.031 1 Month Futures -0.75** 0.132 -0.94* 2 Month Futures 0.173 -1.33* 3 Month Futures 0.389 Next Growing Season -0.32 0.199 Across Growing Season 0.38* 0.116 Offer to Lease Bid to Lease Cash Crop/Capital Crop Cash Crop/Cash Crop 0.52* 0.58** 0.226 0.186 Cash Crop/Env. Cash Crop/Capital Crop 0.90* 0.221 0.10 0.245 Cash Crop/Urban Cash Crop/Env. 1.51*** 1.00* 0.445 0.215 Capital Crop/Cash Crop Cash Crop/Urban 0.191 0.90** 0.23 0.189 Capital Crop/Capital Crop 1.12* Capital Crop/Cash Crop 0.60* 0.343 0.206 Capital Crop/Capital Crop Capital Crop/Env. 1.12** 0.91** 0.395 0.242 Capital Crop/Urban Capital Crop/Env 1.13* -0.39 0.403 0.352 0.45* Env./Cash Crop 2.25* Capital Crop/Urban 0.391 0.209 Env./Capital Crop Env./Cash Crop 0.79*** -0.17*** 0.303 0.249 Env./Capital Crop Env./Urban 0.82*** 0.79** 0.252 0.259 Urban/Cash Crop Env./Urban 1.10** 1.20*** 0.178 0.286 Urban/Cash Crop Urban/Capital Crop 2.13 0.45*** 0.219 0.175 Urban/Env. Urban/Capital Crop 0.71* 0.48 0.277 0.275 4.50 Urban/Env. Constant 0.259 0.240 0.02 Adjusted R2 0.191 F-statistic 43.09 denotes statistically significant at the 1%, 5% and 10 % levels respectively robust standard errors 1. Assess the predictability of this model. Is it a good model or not, explain in detail why, you should use multiple statistical inference techniques. 2. What does the term quantity with its estimated coefficient tell you about the price? Does this make sense? 3. What do the terms 1 month 2 month and 3 month futures tell you about the price considering that the omitted variable here is the spot market? Do these three variables make sense in relation to the spot market price? 4. One of the main issues with regression is multicollinearity. A variance inflation factor was calculated for each of the variables and produced the following results for a few of the variables: In the published paper "Futures contracts in water leasing: an experimental analysis using basin characteristics of the Rio Grande, NM" the following regression equation outputs were estimated to predict the price per acre foot of a water right Table 3: OLS Regression Results to Predict the Price per Acre-Foot for a Temporary Water Right Explanatory Variable Quantity Traded Estimate S.E. -1.95*** 0.119 Dry Surprise 1.46** 0.088 Wet Surprise 1.75** 0.116 -0.21** Trading Month 0.027 -0.15* Trading Year 0.031 1 Month Futures -0.75** 0.132 -0.94* 2 Month Futures 0.173 -1.33* 3 Month Futures 0.389 Next Growing Season -0.32 0.199 Across Growing Season 0.38* 0.116 Offer to Lease Bid to Lease Cash Crop/Capital Crop Cash Crop/Cash Crop 0.52* 0.58** 0.226 0.186 Cash Crop/Env. Cash Crop/Capital Crop 0.90* 0.221 0.10 0.245 Cash Crop/Urban Cash Crop/Env. 1.51*** 1.00* 0.445 0.215 Capital Crop/Cash Crop Cash Crop/Urban 0.191 0.90** 0.23 0.189 Capital Crop/Capital Crop 1.12* Capital Crop/Cash Crop 0.60* 0.343 0.206 Capital Crop/Capital Crop Capital Crop/Env. 1.12** 0.91** 0.395 0.242 Capital Crop/Urban Capital Crop/Env 1.13* -0.39 0.403 0.352 0.45* Env./Cash Crop 2.25* Capital Crop/Urban 0.391 0.209 Env./Capital Crop Env./Cash Crop 0.79*** -0.17*** 0.303 0.249 Env./Capital Crop Env./Urban 0.82*** 0.79** 0.252 0.259 Urban/Cash Crop Env./Urban 1.10** 1.20*** 0.178 0.286 Urban/Cash Crop Urban/Capital Crop 2.13 0.45*** 0.219 0.175 Urban/Env. Urban/Capital Crop 0.71* 0.48 0.277 0.275 4.50 Urban/Env. Constant 0.259 0.240 0.02 Adjusted R2 0.191 F-statistic 43.09 denotes statistically significant at the 1%, 5% and 10 % levels respectively robust standard errors 1. Assess the predictability of this model. Is it a good model or not, explain in detail why, you should use multiple statistical inference techniques. 2. What does the term quantity with its estimated coefficient tell you about the price? Does this make sense? 3. What do the terms 1 month 2 month and 3 month futures tell you about the price considering that the omitted variable here is the spot market? Do these three variables make sense in relation to the spot market price? 4. One of the main issues with regression is multicollinearity. A variance inflation factor was calculated for each of the variables and produced the following results for a few of the variables