

Question
In the Python script, you created a histogram for the dataset generated in Step 1. Check to make sure that this data distribution is skewed

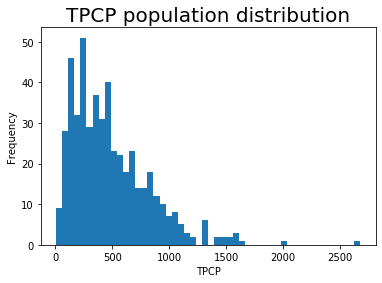
- In the Python script, you created a histogram for the dataset generated in Step 1. Check to make sure that this data distribution is skewed and included in your attachment. See Step 2 in the Python script.
- What is the mean of the TPCP population data? See Step 3 in the Python script.
- In the Python script, you selected a random sample with replacement, of size 50 (note that this is a sufficiently large sample), from the TPCP population. What is the mean of your random sample? Does this sample mean closely approximate the TPCP population mean? See Step 4 in the Python script.
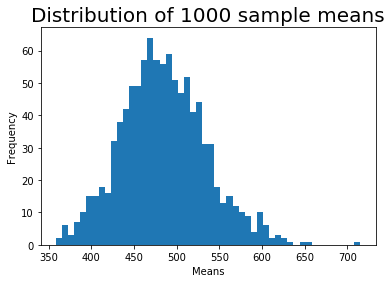
- You also selected 1,000 random samples of size 50 and calculated the mean of each sample. Then you stored those means into a dataframe. Check to make sure the output of this step is in your attachment. See Step 5 in the Python script.
- Review the plotted data distribution for these 1,000 means. Does this approximate a Normal distribution? Does this confirm the first part of the central limit theorem? Why or why not? See Step 6 in the Python script.
- What is the "grand" mean and standard deviation of these 1,000 means? Does the grand mean closely approximate (on a relative basis) the mean of the original distribution? Does this confirm the second part of the central limit theorem? Why or why not?
The data is below
- TPCP data frame TPCP 0 136.0 1 898.0 2 1310.0 3 408.0 4 479.0 .. ... 495 449.0 496 131.0 497 502.0 498 475.0 499 457.0
Population mean = 483.68
Sample mean = 495.0
Dataframe of 1000 sample means means
0 479.141 450.242 486.163 452.604 475.04.. ...995 478.74996 478.24997 543.88998 499.26999 438.32[1000 rows x 1 columns]
Step by Step Solution
There are 3 Steps involved in it
Step: 1

Get Instant Access to Expert-Tailored Solutions
See step-by-step solutions with expert insights and AI powered tools for academic success
Step: 2

Step: 3
Ace Your Homework with AI
Get the answers you need in no time with our AI-driven, step-by-step assistance
Get Started
Trigonometry
Authors: Mark Dugopolski
4th Edition
0321915496, 9780321915498