Question
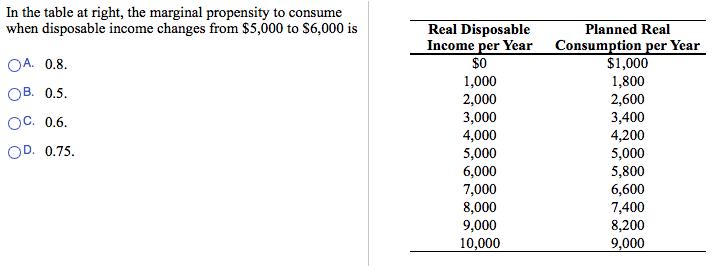
In the table at right, the marginal propensity to consume when disposable income changes from $5,000 to $6,000 is OA. 0.8. OB. 0.5. OC.

In the table at right, the marginal propensity to consume when disposable income changes from $5,000 to $6,000 is OA. 0.8. OB. 0.5. OC. 0.6. OD. 0.75. Real Disposable Income per Year $0 1,000 2,000 3,000 4,000 5,000 6,000 7,000 8,000 9,000 10,000 Planned Real Consumption per Year $1,000 1,800 2,600 3,400 4,200 5,000 5,800 6,600 7,400 8,200 9,000
Step by Step Solution
There are 3 Steps involved in it
Step: 1
Marginal propensity to ...
Get Instant Access to Expert-Tailored Solutions
See step-by-step solutions with expert insights and AI powered tools for academic success
Step: 2

Step: 3

Ace Your Homework with AI
Get the answers you need in no time with our AI-driven, step-by-step assistance
Get StartedRecommended Textbook for
Macroeconomics
Authors: Robert J Gordon
12th edition
138014914, 978-0138014919
Students also viewed these Economics questions
Question
Answered: 1 week ago
Question
Answered: 1 week ago
Question
Answered: 1 week ago
Question
Answered: 1 week ago
Question
Answered: 1 week ago
Question
Answered: 1 week ago
Question
Answered: 1 week ago
Question
Answered: 1 week ago
Question
Answered: 1 week ago
Question
Answered: 1 week ago
Question
Answered: 1 week ago
Question
Answered: 1 week ago
Question
Answered: 1 week ago
Question
Answered: 1 week ago
Question
Answered: 1 week ago
Question
Answered: 1 week ago
Question
Answered: 1 week ago
Question
Answered: 1 week ago
Question
Answered: 1 week ago
Question
Answered: 1 week ago
Question
Answered: 1 week ago
Question
Answered: 1 week ago
View Answer in SolutionInn App


