

Answered step by step
Verified Expert Solution
Question
1 Approved Answer
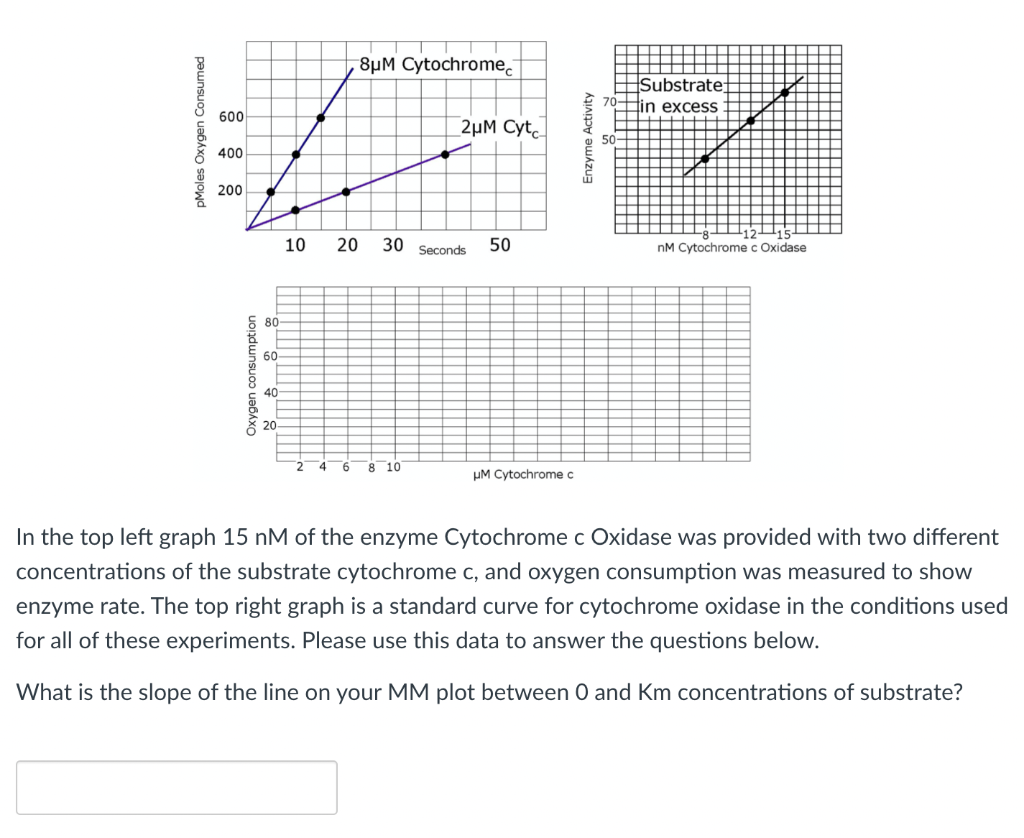
In the top left graph 15nM of the enzyme Cytochrome c Oxidase was provided with two different concentrations of the substrate cytochrome c, and oxygen
Step by Step Solution
There are 3 Steps involved in it
Step: 1

Get Instant Access to Expert-Tailored Solutions
See step-by-step solutions with expert insights and AI powered tools for academic success
Step: 2

Step: 3
Ace Your Homework with AI
Get the answers you need in no time with our AI-driven, step-by-step assistance
Get Started
Organic Chemistry
Authors: Joseph M. Hornback
2nd Edition
9781133384847, 9780199270293, 534389511, 1133384846, 978-0534389512