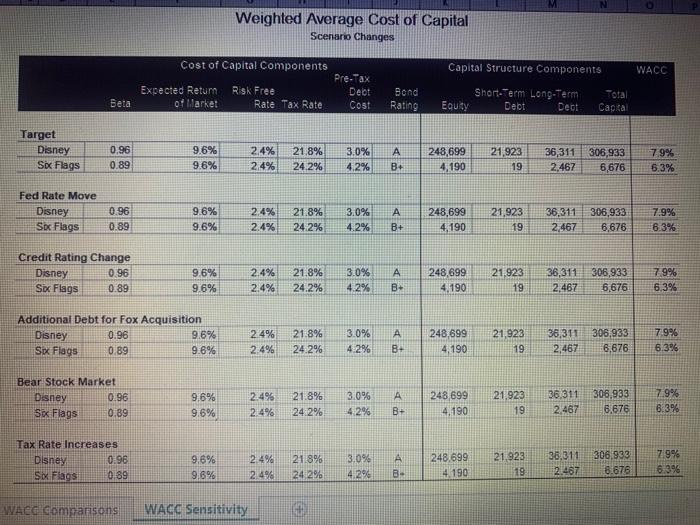
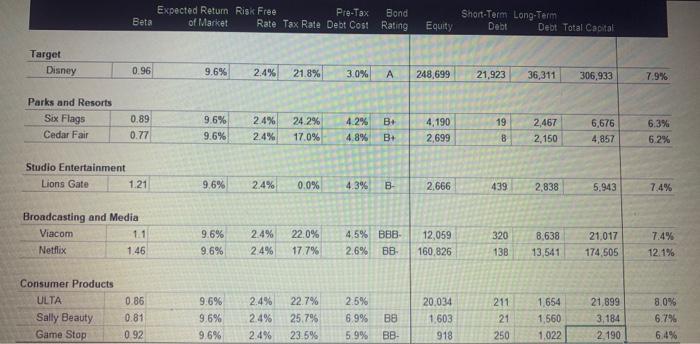
In the WACC Sensitivity tab on the accompanying spreadsheet, alter the cells
as described below to see how changes to WACCs inputs impact the WACC.
Write a few sentences describing each change.
FED RATE INCREASE
An increase of the Federal Reserve interest rate by 200 basis points (2.0%) lifts the borrowing costs of every debt issuer. What is
Disney's adjusted WACC?
CREDIT RATING CHANGE
A downgrade in Disney's credit rating should increase its cost of debt to the same level as Six Flags, all other conditions being
equal. What is Disney's adjusted WACC?
DEBT FOR ACQUISITION
In 2018, Disney announced it would acquire Twenty-First Centry Fox assests for $71.3 billion. Assume Disney paid for the acqui-
sition in cash by raising additional debt. What is Disney's adjusted WACC?
U.S. EQUITY MARKET DOWNTURN
Equity market expectations may cool resulting in an expectation that equity markets may only expand by 200 basis points (2.0%)
over the coming year. What is Disney's adjusted WACC?
INCREASED MARGINAL TAX RATE
The tax rate cut has ended. A new administration is in power. Assume Disney's marginal tax rate rises to 30.0%. What is Disney's adjusted WACC?


Weighted Average Cost of Capital Scenario Changes Cost of Capital Components Capital Structure Components WACC Expected Return of Market Pre-Tax Deot Cost Risk Free Rate Tax Rate Bela Bond Rating Short Term Long Term Equity Dect Dect Total Cap al Target Disney Sbc Flags 0.96 0.89 9.6% 9.6% 2.4% 2.4% 21.8% 24.2% 3.0% 4.2% B+ 248,699 4,190 21,923 19 36,311 306,933 2,467 6,676 79% 6.3% Fed Rate Move Disney Soc Flags 0.96 0.89 9.6% 9.6% 2.4% 2.4% 21.8% 24.2% 3.0% 4.2% B+ 248,699 4,190 21,923 19 36,311 2,467 306,933 6,676 7.9% 6.3% Credit Rating Change Disney 0.96 Sic Flags 9.6% 9.6% 2.4% 2.4% 21.8% 24.2% 3.0% 4.2% A B 248,699 4,190 21,923 19 36,311 306,933 2,467 6,676 7 99% 6.3% 0.89 Additional Debt for Fox Acquisition Disney 0.96 9.6% Sex Flags 0.89 9.6% 24% 2.4% 21.8% 24.2% 3.0% 4.2% A B 248,699 4,190 21,923 19 36,311 306,933 2,467 6,676 79% 6.39% Bear Stock Market Disney 0.96 Sx Flags 0.89 9.6% 9.6% 2.4% 2.4% 21.8% 24.2% 3.0% 42% A B+ 248 699 4.190 21.923 19 36.311 2.467 306.933 6.676 7.9% 8.3% Tax Rate Increases Disney 0.96 Six Flags 0.89 9.6% 9.6% 2.4% 2.49 21.8% 24 2% 3.0% 4.2% A BH 248.699 4,190 21,923 19 36.311 2.487 306,933 8.676 7.9% 6.396 WACG Comparisons WACC Sensitivity Beta Expected Return Risk Free Pre-Tax of Market Rate Tax Rate Debt Cost Bond Rating Equity Short-Term Long-Term Debt Debt Total Capital Target Disney 0.96 9.6% 2.4% 21.8% 3.0% A 248,699 21,923 36,311 306,933 7.9% Parks and Resorts Six Flags Cedar Fair 9.6% 0.89 0.77 2.4% 2.4% 24.2% 17.0% 4.2% 4.8% B+ B+ 4,190 2,699 19 8 9.6% 2,467 2,150 6,676 4,857 6.3% 62% Studio Entertainment Lions Gate 1.21 9.6% 2.4% 0.0% 4.3% B- 2.666 439 2,838 5.943 7.4% Broadcasting and Media Viacom Netflix 1.46 1.1 74% 9.6% 9.6% 2.4% 2.4% 22.0% 17.7% 4.5% B88- 2.6% BB 12,059 160,826 320 138 8.638 13,541 21.017 174,505 12.1% Consumer Products ULTA Sally Beauty Game Stop 0.86 0.81 092 9.6% 9.6% 9.6% 2.4% 2.4% 2.4% 22.7% 25.79% 23.5% 2.5% 6.9% 5.9% BE BB- 20.034 1.603 918 211 21 250 1.654 1,560 1,022 21,899 3,184 2.190 8,0% 6.7% 6.4% Weighted Average Cost of Capital Scenario Changes Cost of Capital Components Capital Structure Components WACC Expected Return of Market Pre-Tax Deot Cost Risk Free Rate Tax Rate Bela Bond Rating Short Term Long Term Equity Dect Dect Total Cap al Target Disney Sbc Flags 0.96 0.89 9.6% 9.6% 2.4% 2.4% 21.8% 24.2% 3.0% 4.2% B+ 248,699 4,190 21,923 19 36,311 306,933 2,467 6,676 79% 6.3% Fed Rate Move Disney Soc Flags 0.96 0.89 9.6% 9.6% 2.4% 2.4% 21.8% 24.2% 3.0% 4.2% B+ 248,699 4,190 21,923 19 36,311 2,467 306,933 6,676 7.9% 6.3% Credit Rating Change Disney 0.96 Sic Flags 9.6% 9.6% 2.4% 2.4% 21.8% 24.2% 3.0% 4.2% A B 248,699 4,190 21,923 19 36,311 306,933 2,467 6,676 7 99% 6.3% 0.89 Additional Debt for Fox Acquisition Disney 0.96 9.6% Sex Flags 0.89 9.6% 24% 2.4% 21.8% 24.2% 3.0% 4.2% A B 248,699 4,190 21,923 19 36,311 306,933 2,467 6,676 79% 6.39% Bear Stock Market Disney 0.96 Sx Flags 0.89 9.6% 9.6% 2.4% 2.4% 21.8% 24.2% 3.0% 42% A B+ 248 699 4.190 21.923 19 36.311 2.467 306.933 6.676 7.9% 8.3% Tax Rate Increases Disney 0.96 Six Flags 0.89 9.6% 9.6% 2.4% 2.49 21.8% 24 2% 3.0% 4.2% A BH 248.699 4,190 21,923 19 36.311 2.487 306,933 8.676 7.9% 6.396 WACG Comparisons WACC Sensitivity Beta Expected Return Risk Free Pre-Tax of Market Rate Tax Rate Debt Cost Bond Rating Equity Short-Term Long-Term Debt Debt Total Capital Target Disney 0.96 9.6% 2.4% 21.8% 3.0% A 248,699 21,923 36,311 306,933 7.9% Parks and Resorts Six Flags Cedar Fair 9.6% 0.89 0.77 2.4% 2.4% 24.2% 17.0% 4.2% 4.8% B+ B+ 4,190 2,699 19 8 9.6% 2,467 2,150 6,676 4,857 6.3% 62% Studio Entertainment Lions Gate 1.21 9.6% 2.4% 0.0% 4.3% B- 2.666 439 2,838 5.943 7.4% Broadcasting and Media Viacom Netflix 1.46 1.1 74% 9.6% 9.6% 2.4% 2.4% 22.0% 17.7% 4.5% B88- 2.6% BB 12,059 160,826 320 138 8.638 13,541 21.017 174,505 12.1% Consumer Products ULTA Sally Beauty Game Stop 0.86 0.81 092 9.6% 9.6% 9.6% 2.4% 2.4% 2.4% 22.7% 25.79% 23.5% 2.5% 6.9% 5.9% BE BB- 20.034 1.603 918 211 21 250 1.654 1,560 1,022 21,899 3,184 2.190 8,0% 6.7% 6.4%


