Question
In this lab, youll develop a Java program that loads data from a CSV file and draws a pie chart using the data collected. USE
In this lab, youll develop a Java program that loads data from a CSV file and draws a pie chart using the data collected. USE JAVAFX
Load in the contents of the supplied data file (weatherwarnings-2015.csv), which contains a list of weather warnings in the US in 2015. The 6th column contains the type of warning (FLASH FLOOD, SEVERE THUNDERSTORM, SPECIAL MARINE, TORNADO). Count the number of each warning type.
Hint: I suggest you use a Map to keep count. Create a pie chart of the counts of each warning type. The pie chart should be to the right of the window. In the left of the window should be a simple legend. The warning types, and how many warning types there are, should not be hard coded into your program but taken from the file itself.
CSV file: https://github.com/KushalRep/CSV
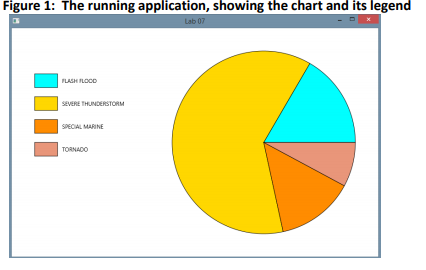
Figure 1: The running application, showing the chart and its legend SEVERE THUNDERSTORM SDEOAL MARINE TORNADOStep by Step Solution
There are 3 Steps involved in it
Step: 1

Get Instant Access to Expert-Tailored Solutions
See step-by-step solutions with expert insights and AI powered tools for academic success
Step: 2

Step: 3
Ace Your Homework with AI
Get the answers you need in no time with our AI-driven, step-by-step assistance
Get Started