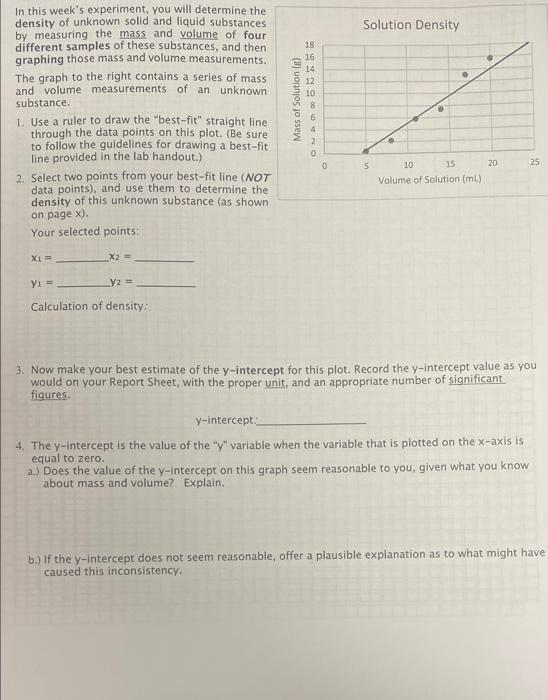
In this week's experiment, you will determine the density of unknown solid and liquid substances by measuring the mass and volume of four different samples of these substances, and then graphing those mass and volume measurements. The graph to the right contains a series of mass and volume measurements of an unknown substance. 1. Use a ruler to draw the "best-fit" straight line through the data points on this plot. (Be sure to follow the guidelines for drawing a best-fitline provided in the lab handout.) 2. Select two points from your best-fit line (NOT data points), and use them to determine the density of this unknown substance (as shown on page x ). Your selected points: x1=y1=x2=y2= Calculation of density: 3. Now make your best estimate of the y-intercept for this plot. Record the y-intercept value as you would on your Report Sheet, with the proper unit, and an appropriate number of significant. figures. y-intercept: 4. The y-intercept is the value of the " y " variable when the variable that is plotted on the x-axis is equal to zero. a.) Does the value of the y-intercept on this graph seem reasonable to you, given what you know about mass and volume? Explain. b.) If the y-intercept does not seem reasonable, offer a plausible explanation as to what might have caused this inconsistency. In this week's experiment, you will determine the density of unknown solid and liquid substances by measuring the mass and volume of four different samples of these substances, and then graphing those mass and volume measurements. The graph to the right contains a series of mass and volume measurements of an unknown substance. 1. Use a ruler to draw the "best-fit" straight line through the data points on this plot. (Be sure to follow the guidelines for drawing a best-fitline provided in the lab handout.) 2. Select two points from your best-fit line (NOT data points), and use them to determine the density of this unknown substance (as shown on page x ). Your selected points: x1=y1=x2=y2= Calculation of density: 3. Now make your best estimate of the y-intercept for this plot. Record the y-intercept value as you would on your Report Sheet, with the proper unit, and an appropriate number of significant. figures. y-intercept: 4. The y-intercept is the value of the " y " variable when the variable that is plotted on the x-axis is equal to zero. a.) Does the value of the y-intercept on this graph seem reasonable to you, given what you know about mass and volume? Explain. b.) If the y-intercept does not seem reasonable, offer a plausible explanation as to what might have caused this inconsistency