In Touch with Data: Convergence or Divergence
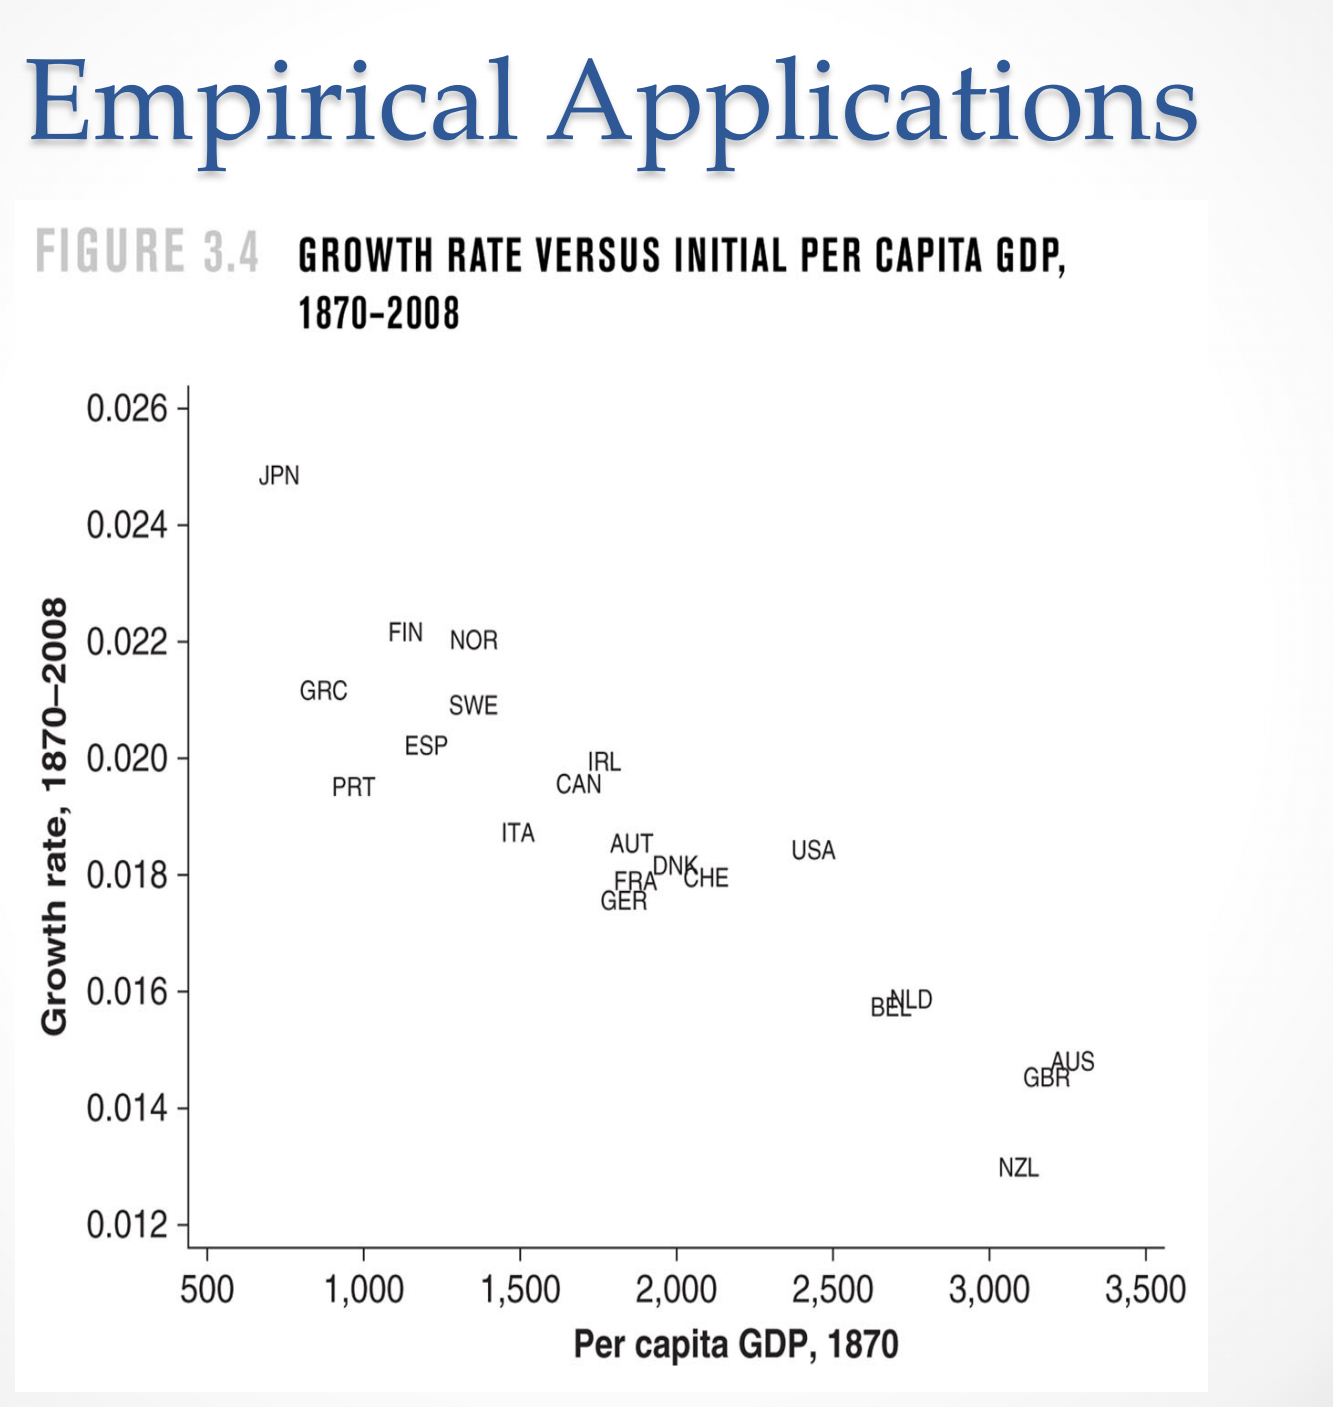
This problem asks you to collect and analyze data about the relationship of the initial income level and the growth rates across countries. or. Find real GDP per capita for 10 highincome countries from 1950 to 20171 and calculate the average annual growth rate of real GDP per capita for each country over this period. You may choose ten countries from Figure 3.4 in the textbook (it is also on the lecture slides of the Solow Model). Include New Zealand, Germany and Japan. b. Repeat Part (a) but for 10 low-income countries. Include some countries in Sub- Saharran Africa. c. Draw two gures using the data you have collected in Part (a) and (b) with each point representing a country. Use the horizontal axis to represent GDP per capita in 1950, and the vertical axis the average annual growth rate during 1950-2017. The rst gure should include countries in Part (a) only, and the second gure should include countries in both Part (a) and (b). Can you observe cross-country income convergence in these gures? 0!. Can the Solow model explain the patterns above? Explain. Instruction for data work: 1. Download data from Penn World Table 9.1 using the following link: Penn World Table 9.1 Use excel sheets for all data work. 2. Download data of the variable RGDPO. This is the real GDP (aggregate). The same excel sheet also includes population data. You need these two variables to calculate real GDP per capita. Be careful with the unit used in the dataset. 3. Calculate the average annual growth rate of real GDP per capita. The growth rate from year t1 to year t2 can be calculated by: 9:, -12 = 121:1 111(th [1911), where y.- is the GDP per capita of year 2', and la is the natural log term. 4. For country classication by income level, refer to website of the United Nation: Country Classication (see Table E) 5. Data presentation: (1) Make a. table as below (add more rows as needed): country name country classication y1g5o is the real GDP per capita in 1950. 919504017 is the average annual growth rate during 1950-2017. (2) Draw your gures using excel sheets as well. Attach the gures (not the raw data) 919502017 with your assignment. 6. If data of early years (e.g., 1950) are not available for some countries in your list, use as many years as possible to include the earliest year available. Empirical Applications FIGURE 3.4 GROWTH RATE VERSUS INITIAL PER CAPITA GDP, 1870-2008 0.026- JPN 0.024 Growth rate, 1870-2008 0.022 FIN NOR GRC SWE 0.020 - ESP PRT IRL CAN ITA 0.018 AUT RADNCHE USA GER 0.016 BALD 0.014 - GBAUS NZL 0.012 500 1,000 1,500 2,000 2,500 3,000 3,500 Per capita GDP, 1870


