In what may be a first for the hospitability industry, Brian Collins, hotel owner, has asked James McBride, Ritz-Carlton general manager, to lengthen the amount of time spent training hotel employees before hotel opening. For this assignment, you are taking the role of James McBride. I am asking you to generate a two-page memo (+ appendices) where you present your decision to Brian Collins.
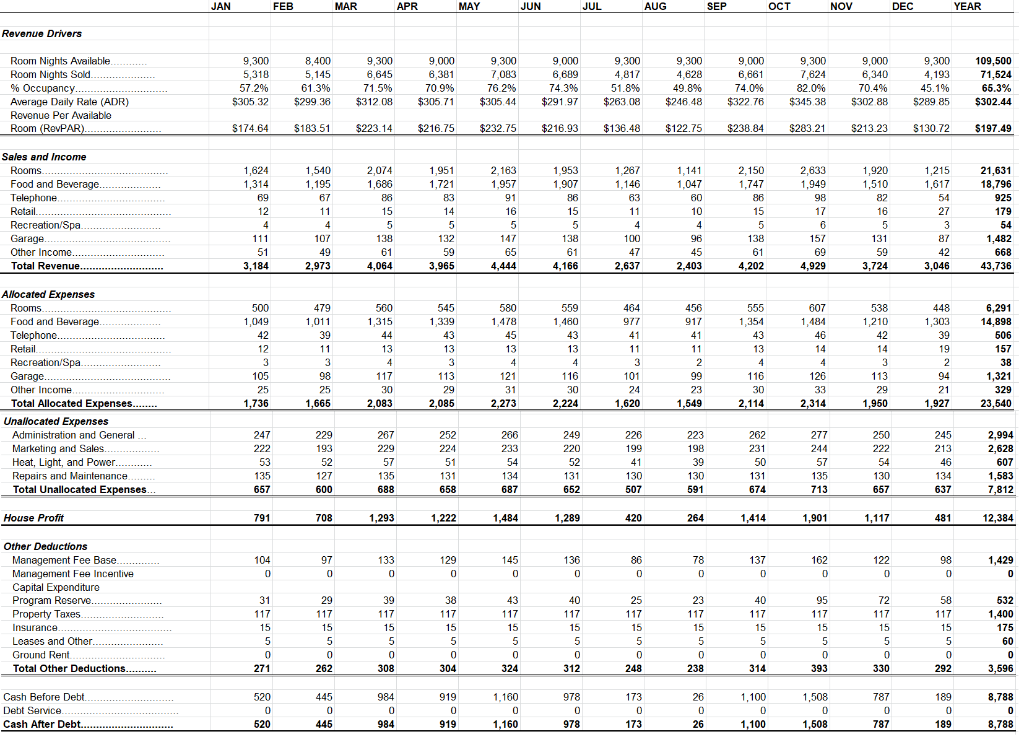
What would be the monetary consequences of opening directly at 80% occupancy as requested by rather than ramping up from 50% to 80% over a four-month period of time?
Please show your work!

JAN FEB MAR APR MAY JUN JUL AUG SEP NOV DEC YEAR Revenue Drivers Room Nights Available Room Nights Sold % Occupancy... Average Daily Rate (ADR) Revenue Per Available Room (RevPAR)....................... 9,300 5,318 57.2% $305 32 8,400 5,145 61.3% $299 38 9,300 6,645 71.5% $312.08 9.000 6,381 70.995 $305 71 9.300 7,083 7 6 205 $305.44 9.000 6689 74.3% $291.97 9,300 4,817 51.8% $263.08 9,300 4,628 49.8% $246.48 9,000 6,661 74.0% $322.76 9,300 7,624 82.0% $345 38 9.000 6,340 70.4% $302 88 9,300 4,193 45.1% $289 85 109,500 71,524 65.3% $302.44 $174.64 $183.51 $223.14 $223.14 $216.75 $232.75 $216.93 $136.48 $122.75 $238.84 $283.21 $213.23 $130.72 $197.49 1,624 1,314 69 1,540 1,195 67 2,074 1,686 2,163 1,957 91 1,953 1,907 86 Sales and Income Rooms. Food and Beverage......... Telephone Retail...... Recreation/Spa Garage. Other Income......... Total Revenue... 1,267 1,146 63 11 2,150 1,747 86 1,951 1,721 83 14 5 132 1,141 1,047 60 10 1,920 1,510 82 2,633 1,949 98 17 1,215 1,617 54 27 3 87 21,631 18,796 925 179 12 15 16 15 16 5 5 5 138 5 147 5 138 111 107 100 96 138 157 131 49 61 59 65 61 47 45 69 42 51 3,184 61 4,202 59 3,724 1.482 668 43,736 2,973 4,064 3,965 4,444 4,166 2,637 2,403 4,929 3.046 545 500 1,049 479 1,011 39 559 1,460 580 1,478 45 538 1,210 448 1,303 6,291 14,898 1339 560 1,315 44 13 464 977 41 11 456 917 41 11 555 1,354 43 13 607 1,484 46 14 42 43 42 506 43 13 39 19 14 105 117 116 99 116 113 Allocated Expenses Rooms Food and Beverage Telephone... Retail Recreation/Spa.. Garage... Other Income... Total Allocated Expenses........ Unallocated Expenses Administration and General... Marketing and Sales Heat, Light, and Power.. Repairs and Maintenance......... Total Unallocated Expenses. 98 25 113 29 2,085 101 24 1,620 126 33 30 157 38 1,321 329 23,540 23 1,736 1,665 2,083 2,273 2.224 1,549 29 1,950 2,114 2,314 1,927 223 267 229 249 220 245 206 233 226 199 277 244 247 222 53 135 657 229 193 52 127 600 252 224 51 131 658 198 39 57 250 222 54 54 134 57 262 231 50 131 674 52 131 41 130 507 213 46 134 637 2,994 2,628 607 1,583 7,812 135 688 130 591 135 713 130 657 687 652 House Profit 791 708 1,293 1,222 1,484 1,289 1,414 1,901 1,117 481 12,384 104 97 145 129 0 136 137 162 133 0 1,429 0 122 0 98 0 0 0 39 95 Other Deductions Management Fee Base............ Management Fee Incentive Capital Expenditure Program Reserve............ Property Taxes Insurance..... Leases and Other. Ground Rent Total Other Deductions.......... 117 117 117 15 15 5 117 15 5 0 304 117 15 5 40 117 15 5 0 314 5 532 1,400 175 60 5 0 262 72 117 15 5 0 330 117 15 5 0 393 5 0 0 5 0 238 0 0 271 0 0 324 308 312 248 292 3,596 984 1,100 1,508 189 Cash Before Debt. Debt Service Cash After Debt 520 0 520 445 0 445 919 0 0 984 1.160 0 1,160 978 0 978 173 0 173 787 0 787 8,788 0 1898,788 26 1,100 1,508 JAN FEB MAR APR MAY JUN JUL AUG SEP NOV DEC YEAR Revenue Drivers Room Nights Available Room Nights Sold % Occupancy... Average Daily Rate (ADR) Revenue Per Available Room (RevPAR)....................... 9,300 5,318 57.2% $305 32 8,400 5,145 61.3% $299 38 9,300 6,645 71.5% $312.08 9.000 6,381 70.995 $305 71 9.300 7,083 7 6 205 $305.44 9.000 6689 74.3% $291.97 9,300 4,817 51.8% $263.08 9,300 4,628 49.8% $246.48 9,000 6,661 74.0% $322.76 9,300 7,624 82.0% $345 38 9.000 6,340 70.4% $302 88 9,300 4,193 45.1% $289 85 109,500 71,524 65.3% $302.44 $174.64 $183.51 $223.14 $223.14 $216.75 $232.75 $216.93 $136.48 $122.75 $238.84 $283.21 $213.23 $130.72 $197.49 1,624 1,314 69 1,540 1,195 67 2,074 1,686 2,163 1,957 91 1,953 1,907 86 Sales and Income Rooms. Food and Beverage......... Telephone Retail...... Recreation/Spa Garage. Other Income......... Total Revenue... 1,267 1,146 63 11 2,150 1,747 86 1,951 1,721 83 14 5 132 1,141 1,047 60 10 1,920 1,510 82 2,633 1,949 98 17 1,215 1,617 54 27 3 87 21,631 18,796 925 179 12 15 16 15 16 5 5 5 138 5 147 5 138 111 107 100 96 138 157 131 49 61 59 65 61 47 45 69 42 51 3,184 61 4,202 59 3,724 1.482 668 43,736 2,973 4,064 3,965 4,444 4,166 2,637 2,403 4,929 3.046 545 500 1,049 479 1,011 39 559 1,460 580 1,478 45 538 1,210 448 1,303 6,291 14,898 1339 560 1,315 44 13 464 977 41 11 456 917 41 11 555 1,354 43 13 607 1,484 46 14 42 43 42 506 43 13 39 19 14 105 117 116 99 116 113 Allocated Expenses Rooms Food and Beverage Telephone... Retail Recreation/Spa.. Garage... Other Income... Total Allocated Expenses........ Unallocated Expenses Administration and General... Marketing and Sales Heat, Light, and Power.. Repairs and Maintenance......... Total Unallocated Expenses. 98 25 113 29 2,085 101 24 1,620 126 33 30 157 38 1,321 329 23,540 23 1,736 1,665 2,083 2,273 2.224 1,549 29 1,950 2,114 2,314 1,927 223 267 229 249 220 245 206 233 226 199 277 244 247 222 53 135 657 229 193 52 127 600 252 224 51 131 658 198 39 57 250 222 54 54 134 57 262 231 50 131 674 52 131 41 130 507 213 46 134 637 2,994 2,628 607 1,583 7,812 135 688 130 591 135 713 130 657 687 652 House Profit 791 708 1,293 1,222 1,484 1,289 1,414 1,901 1,117 481 12,384 104 97 145 129 0 136 137 162 133 0 1,429 0 122 0 98 0 0 0 39 95 Other Deductions Management Fee Base............ Management Fee Incentive Capital Expenditure Program Reserve............ Property Taxes Insurance..... Leases and Other. Ground Rent Total Other Deductions.......... 117 117 117 15 15 5 117 15 5 0 304 117 15 5 40 117 15 5 0 314 5 532 1,400 175 60 5 0 262 72 117 15 5 0 330 117 15 5 0 393 5 0 0 5 0 238 0 0 271 0 0 324 308 312 248 292 3,596 984 1,100 1,508 189 Cash Before Debt. Debt Service Cash After Debt 520 0 520 445 0 445 919 0 0 984 1.160 0 1,160 978 0 978 173 0 173 787 0 787 8,788 0 1898,788 26 1,100 1,508


