Answered step by step
Verified Expert Solution
Question
1 Approved Answer
In your answers you need to provide screenshots from SPSS. Part A Assume that you are Marketing Manager and you were asked to assess whether
In your answers you need to provide screenshots from SPSS.
Part A
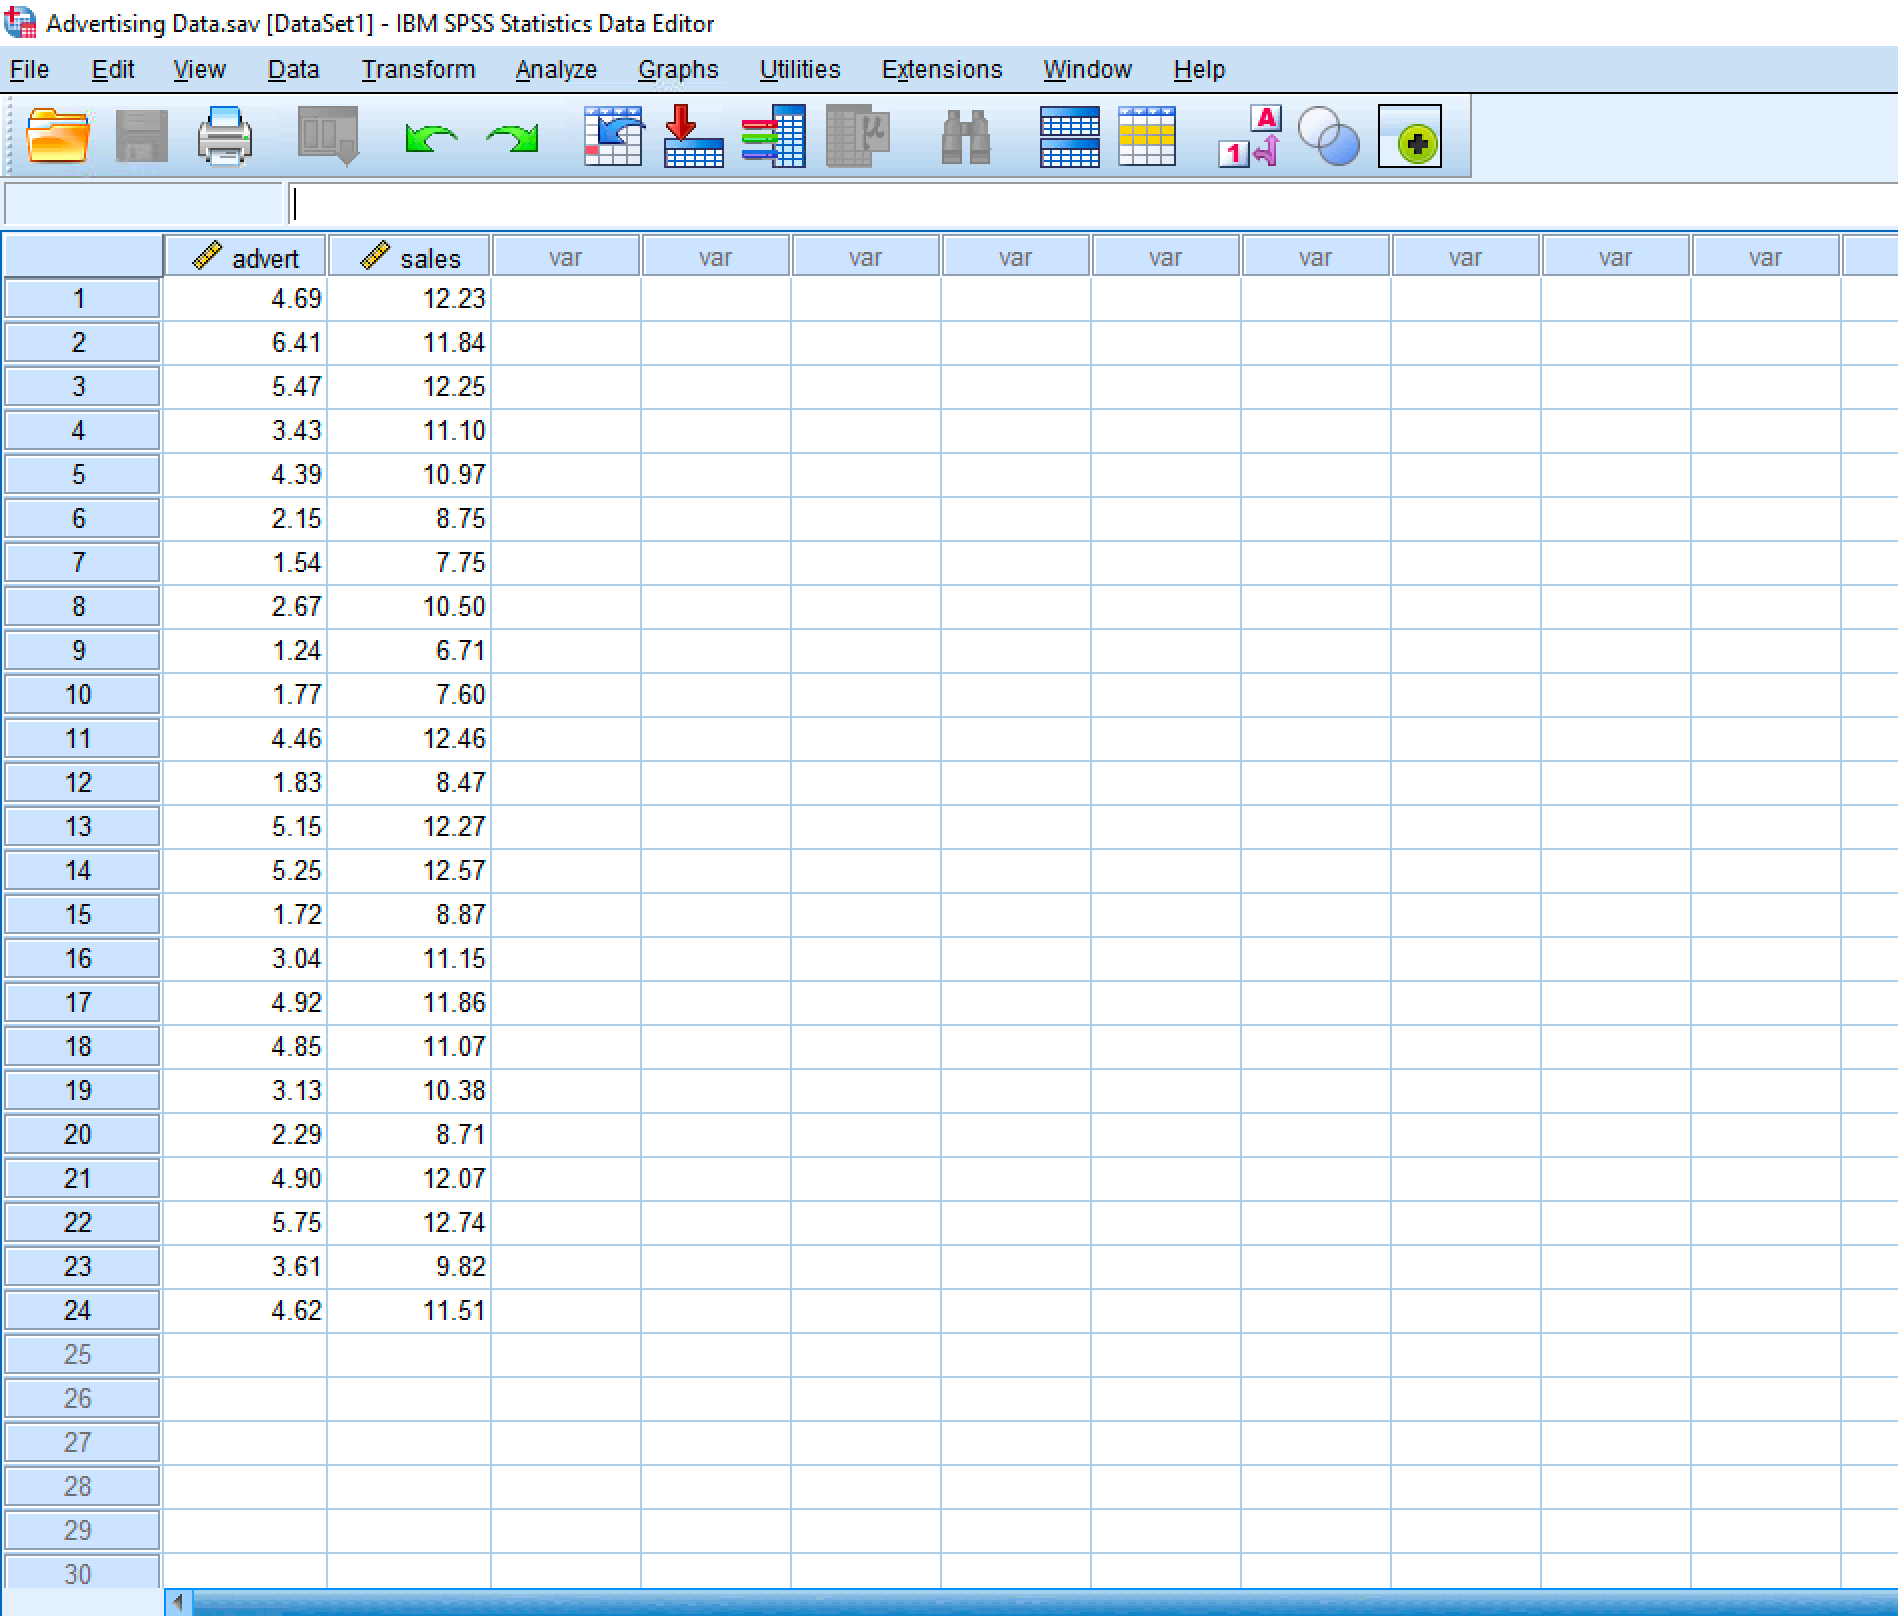
Assume that you are Marketing Manager and you were asked to assess whether there is any association between Advertising and Sales. For this task you are given the following dataset:
SPSS Data - Advertising
- Perform Correlation Analysis between Sales and Advertising in SPSS and interpret the results. Make sure you clearly state Null and Alternative hypotheses.
- Why would you as a Marketing Manager be interested in these results? What you can learn from this analysis and how it can be useful in future?
- Visually explore data by producing scatterplot in SPSS for Sales and Advertising. Do you see any concerns and do you have any suggestions here?
Part B
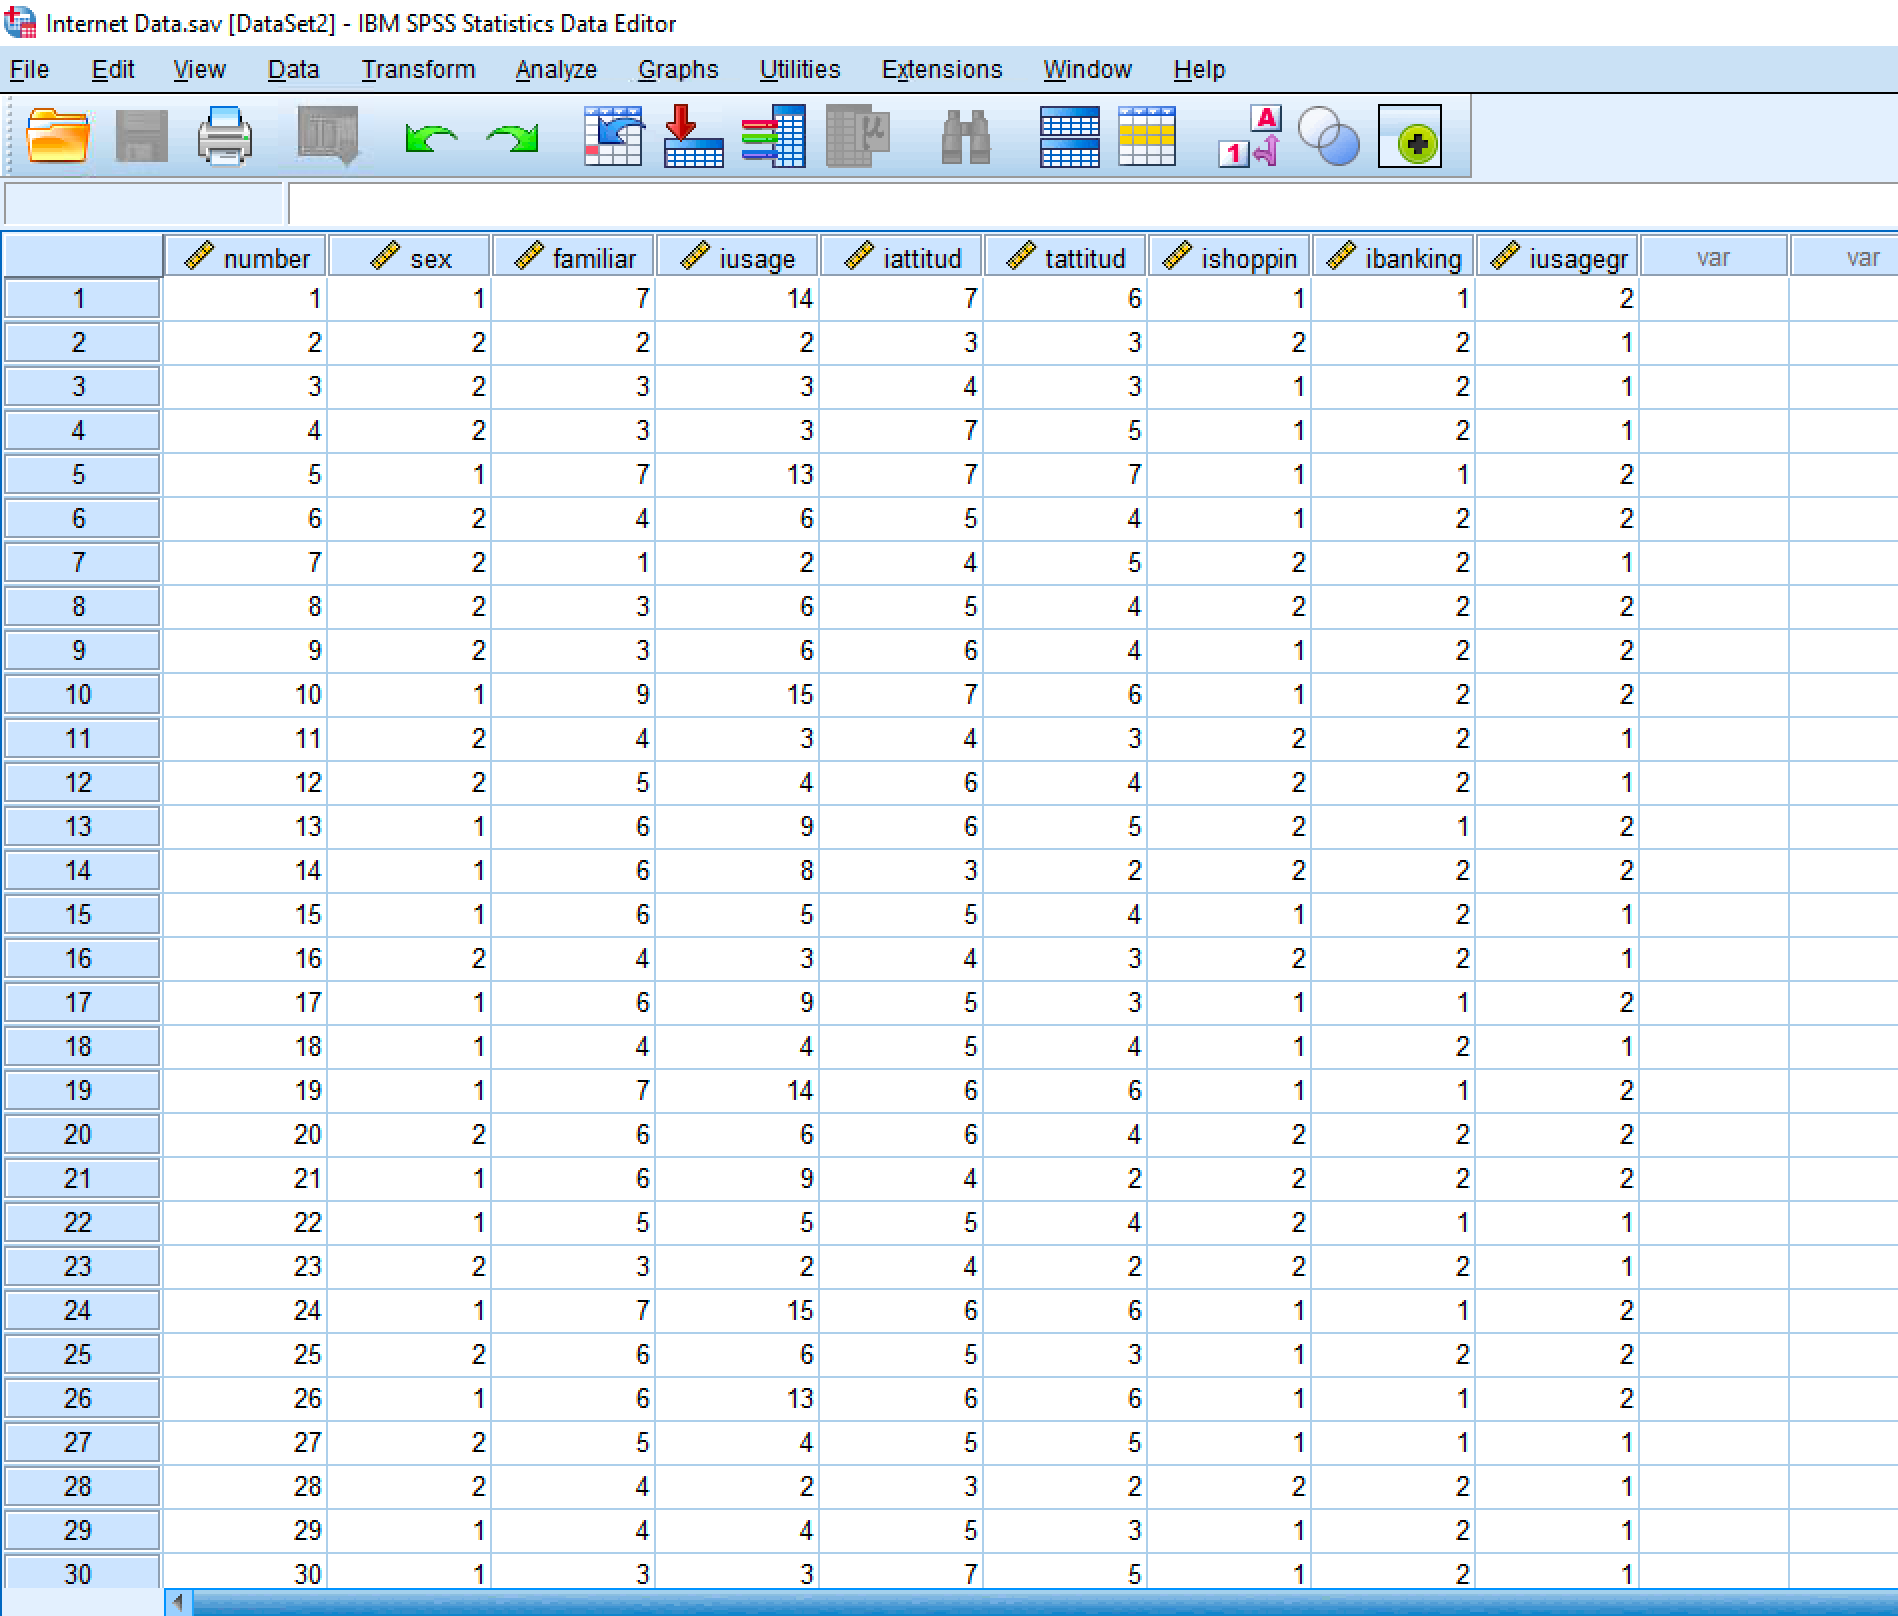
In this part you will continue working withInternet UsageSPSS dataset. Your task is to explain what influences how intensive people use Internet. To understand this, you need to run multiple Regression.
SPSS Data - Internet Usage
- Run multiple Regression with "Internet Usage Hrs/Week" as dependent variable and the following independent variables:
- Attitude toward Internet
- Attitude toward Technology
- Sex
- Perform analysis of SPSS output:
- Using F-test check if model is valid
- Investigate significance of regression coefficient and provide their interpretation
- Assess the overall fit of the model
- How this analysis can be used by Marketing Manager?


Step by Step Solution
There are 3 Steps involved in it
Step: 1

Get Instant Access to Expert-Tailored Solutions
See step-by-step solutions with expert insights and AI powered tools for academic success
Step: 2

Step: 3

Ace Your Homework with AI
Get the answers you need in no time with our AI-driven, step-by-step assistance
Get Started


