Answered step by step
Verified Expert Solution
Question
1 Approved Answer
INCIDENCE OF ADOPTION-S-SHAPED CURVE Below is a dataset that shows the percent of a population by men and women living in a metropolitan area that
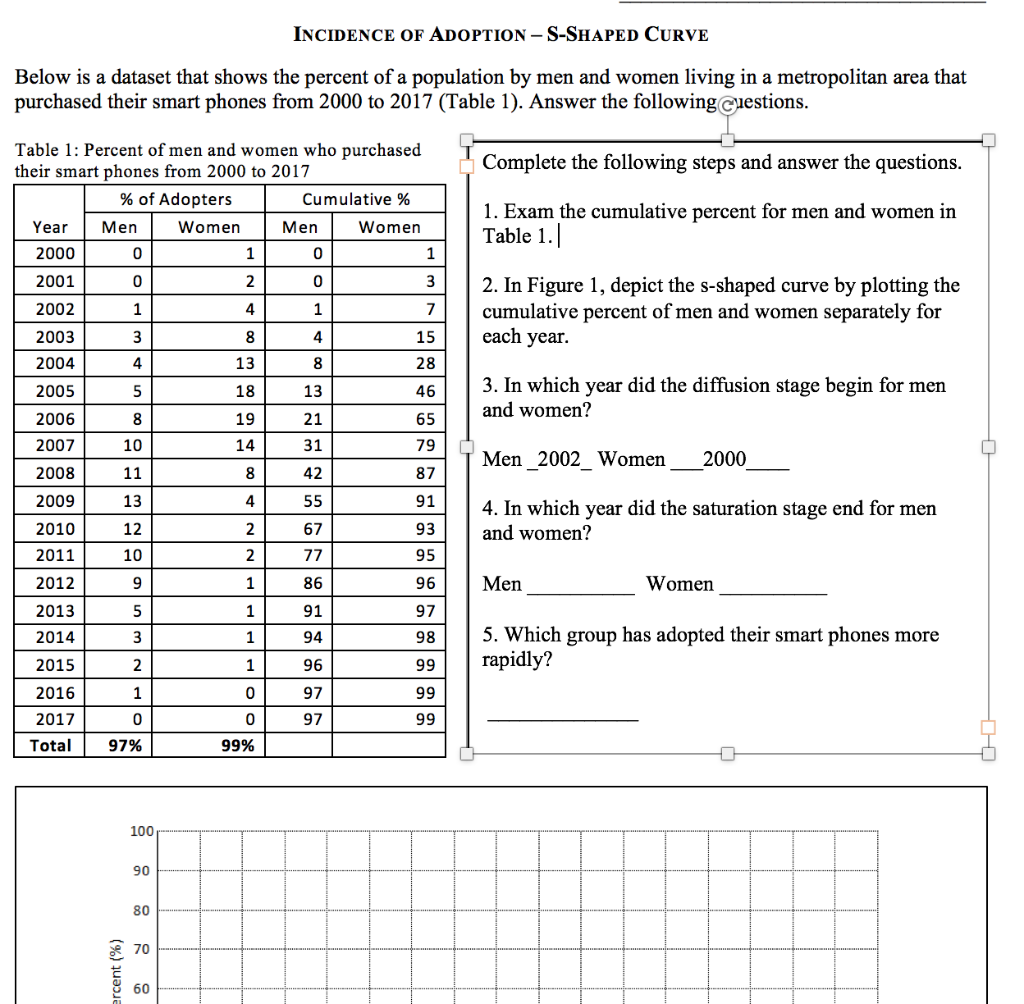
INCIDENCE OF ADOPTION-S-SHAPED CURVE Below is a dataset that shows the percent of a population by men and women living in a metropolitan area that purchased their smart phones from 2000 to 2017 (Table 1). Answer the following cuestions. Complete the following steps and answer the questions. Table 1: Percent of men and women who purchased their smart phones from 2000 to 2017 % of Adopters Cumulative % Year Men Women Men Women 2000 0 1 0 1 1. Exam the cumulative percent for men and women in Table 1. 2001 0 2 0 3 2. In Figure 1, depict the s-shaped curve by plotting the cumulative percent of men and women separately for 2002 1 4 1 7 2003 3 8 4 15 each year. 2004 4 13 8 28 2005 5 18 13 46 3. In which year did the diffusion stage begin for men and women? 2006 8 19 21 65 2007 10 14 31 79 Men _2002_ Women 2000 2008 11 8 42 87 2009 13 4 55 91 93 2010 4. In which year did the saturation stage end for men and women? 12 2 67 2011 10 2 77 95 2012 9 1 86 96 Men Women 2013 5 1 91 94 97 98 2014 3 1 5. Which group has adopted their smart phones more rapidly? 2015 2 1 96 99 2016 1 0 97 97 99 99 2017 0 0 Total 97% 99% 100 90 80 70 rcent (%) 60
Step by Step Solution
There are 3 Steps involved in it
Step: 1
Get Instant Access to Expert-Tailored Solutions
See step-by-step solutions with expert insights and AI powered tools for academic success
Step: 2
Step: 3
Ace Your Homework with AI
Get the answers you need in no time with our AI-driven, step-by-step assistance
Get Started