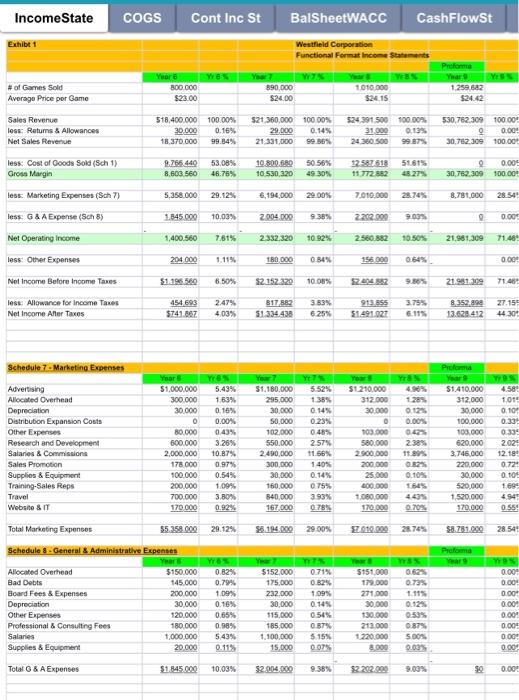
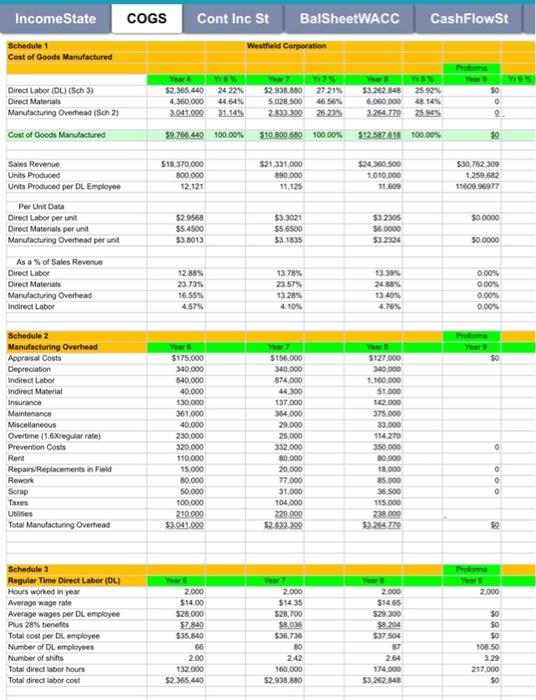
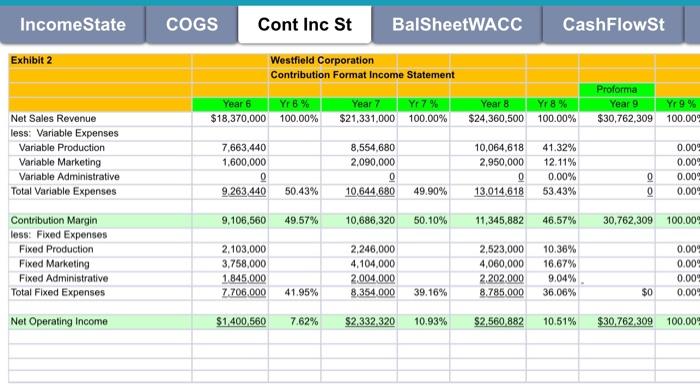
Income State COGS Cont Inc St BalSheetWACC CashFlowSt Exhibt 1 Westfield Corporation Functional Format Income Statements Proforma YE # of Games Sold Average Price per Game Years WS 800.000 $23.00 890,000 S24.00 1010000 $24.15 1.259.682 $24.42 Sales Revenue less Returns & Allowances Net Sales Revenue 518,400,000 100.00% 30.000 0.16% 18.370.000 99.84% 521360.000 100.00% 29.000 0.14% 21.331,000 99.86% 524 391.500 100.00% 31.000 0.139 24.360 500 99.87% 530,762.309 100.00 0.00 30,752,309 100.000 less: Cost of Goods Sold(sch 1) Gross Margin 9.765.440 8.603 560 53.08% 46.75% 10.800.680 10.530,320 50 56% 49 30% 12 587 518 15.772882 51615 48.27% 30.762.309 0.00 100.00 5.358.000 29.12% 6,194,000 29.00% 7.010.000 20.76% 8.781.000 2854 less: Marketing Expenses (Sch 7) less G&A Expense (Sch) Net Operating income 1.845 000 10.03% 2004.000 9.35% 2262.000 O 0.00 1,400.560 7,61% 2.332.320 10 92% 2560.882 10.50% 21.981.309 71.48 less Other Expenses 204000 1.11% 150 000 0.84% 156 390 0.00 Not Income Before Income Taxes $1.196560 6.50% 32.152 320 100% 200432 9.86% 21.951,309 71.48 3.755 less Allowance for Income Taxes Net Income After Taxes 454 693 $741.667 2.47% 4.03% 317883 51.334438 3.33% 6.25% 913555 $1491.027 8.352.89 13.628 412 27.154 44 30+ Schedule 7 - Marketing Expenses YES S1210,000 312.000 30.000 4.580 1.014 1285 012 0.00% 0.10 Advertising Allocated Overhead Depreciation Distribution Expansion Costs Other Expenses Research and Development Salanes & Commissions Sales Promotion Supplies & Equipment Training-Sales Reps Travel Website & IT Year $1.000.000 300.000 30.000 0 80.000 600.000 2.000.000 178.000 100.000 200.000 700.000 170.000 YEN 5.43% 1.63% 0.16% 0.00% 0.43% 3.26% 10.87% 0.97% 0.54% 1.09% 3.80% 0.92% $1,180.000 295,000 30.000 50.000 102.000 550.000 2.490,000 300.000 30.000 150.000 840,000 167.000 5.52% 1.35% 0.14% 0.23% 0.48% 2.57% 11.56% 1405 0.14% 0.755 3.93% 0.78% Proforma Year $1.410.000 312.000 30.000 100.000 103.000 620.000 3.746.000 220,000 30.000 520.000 1,520,000 170.000 103.900 580.000 2.900.000 200.000 25.000 600.000 1.080.000 170.000 238% 11.895 0.33 0:33 2.024 12.18 0.72 0.10 1.69 0.10% 4439 70% 055 Total Marketing Expenses $5.358002 29.12% 8.194.000 29.00% 2019.000 28.74% $8.781.000 2854 Schedule 8 - General Administrative Expenses Proforma Years WS Was 0.001 0.00 0.00 Allocated Overhead Bad Debts Board Fees & Expenses Depreciation Other Expenses Professional & Consulting Fees Salaries Supplies & Equipment 0001 Yes 0.82% 0.79% 1.09% 0.16% 0.65% 0.98% 5.43% 0.11% $150.000 145.000 200.000 30.000 120.000 180.000 1.000.000 20.000 $152.000 175,000 232.000 30,000 $15.000 185.000 1.100.000 15,000 0.71% 0329 109% 0.14% 0545 0.87% 5.15% 0.07% 5151.000 179.000 271.000 30,000 130.000 213.000 1220.000 8.000 0.73% 1.115 0.12% 0.59% 0.87% 5.00% 0.00% 0.00 0.004 0.00 0.00 Total & A Expenses $1.845.000 10.03% $2.0004 000 9.38% 2202.000 $0 0.000 Income State COGS Cont Inc St BalSheetWACC CashFlowSt Westfield Corporation Schedule 1 Cost of Good Manufactured Yes $2.365.440 24.22% 4.360.000 44.64% 3.041.000 31.145 Direct Labor (DL) (sch 3) Direct Materials Manufacturing Overhead (Sch 2) Cost of Goods Manufactured $2.938.880 5.028.500 2833.202 25 27 21% 46.56% 25 23% Y 33.262.340 25.92% 6.080.000 8.149 3.264 779 50 . $9.765 440 100.00% $10.800.680 100.00% $12.587 518 100.00% $ $18,370,000 800.000 12.121 $21.331.000 890.000 11.125 $24.360.500 1010.000 11.609 $30,762,309 1.259.682 11609.56977 Sales Revenue Units Produced Units Produced per DL Employee Per Unit Data Direct Labor per unit Direct Materials per unit Manufacturing Overhead per unit $32305 50.0000 529568 $5.4500 $3.8013 $33021 55.6500 $3.5835 S60000 $32324 30 0000 As a % of Sales Revenue Direct Labor Direct Materials Manufacturing Overhead Indirect Labor 12.88% 23.73% 16.55% 4.57% 13.78% 23.57% 13.28% 4.10% 13 24 38 13.409 4.76% 0.00% 0.00% 0.00% 0.00% Pro Ya 50 Schedule 2 Manufacturing Overhead Appraisal Costs Depreciation Indirect Labor Indirect Material Insurance Maintenance Miscellaneous Overtime (1.6Xregularrate) Prevention Costs Rent Repairs Replacements in Field Rework Scrap Taxes Utilities Total Manufacturing Overhead Year $175.000 340.000 840.000 40.000 130.000 361.000 40.000 230.000 320.000 110.000 55.000 80.000 50.000 100.000 210.000 $3.041.000 Yes $156,000 340.000 874 000 44 300 137.000 364.000 29.000 25,000 332.000 80.000 20.000 77,000 31,000 104.000 220.000 $2.833.300 Yet $127.000 340.000 1150 000 51000 142.000 375.000 33.000 114 270 350.000 80.000 18.000 85.000 36. SOO 115.000 238 000 $3254 779 0 0 0 $ Protoma 2.000 2.000 $14.65 Schedule 3 Regular Time Direct Labor (DL) Hours worked in year Average wage rate Average wages per DL employee Plus 28% benefits Total cost per DL employee Number of DL employees Number of shifts Total direct labor hours Total direct labor cost 2.000 $14.00 $28.000 $7840 $35.840 66 2.000 $1435 528.700 SROM $36.738 80 242 160.000 $2.938.880 $8.204 $37504 87 264 174.000 $3.262 848 $ $0 108.50 3.29 217.000 200 132.000 $2 365.440 Income State COGS Cont Inc St BalSheetWACC CashFlowSt Exhibit 2 Westfield Corporation Contribution Format Income Statement Year 6 Yr 5% $18,370,000 100.00% Year 7 Yf7% $21,331,000 100.00% Year 8 $24,360,500 Yr 8 % 100.00% Proforma Year 9 $30,762,309 Yr9% 100.00 Net Sales Revenue less: Variable Expenses Variable Production Variable Marketing Variable Administrative Total Variable Expenses 7,663,440 1,600,000 8,554,680 2,090,000 0 10,644 680 10,064,618 2,950.000 0 13,014 618 41.32% 12.11% 0.00% 53.43% 0.00 0.009 0.00 0.00 0 0 9.263.440 50.43% 49.90% 9,106,560 49.57% 10,686,320 50.10% 11,345,882 46.57% 30,762,309 100.00 Contribution Margin less: Fixed Expenses Fixed Production Fixed Marketing Fixed Administrative Total Fixed Expenses 2,103,000 3,758,000 1.845.000 7706.000 2,246,000 4,104,000 2.004.000 8.354.000 2,523,000 4,060,000 2.202.000 8,785.000 10.36% 16.67% 9.04% 36.06% 0.009 0.009 0.009 0.00% 41.95% 39.16% $0 Net Operating Income $1,400,560 7.62% $2,332 320 10.93% $2,560 882 10.51% $30,762 309 100.00