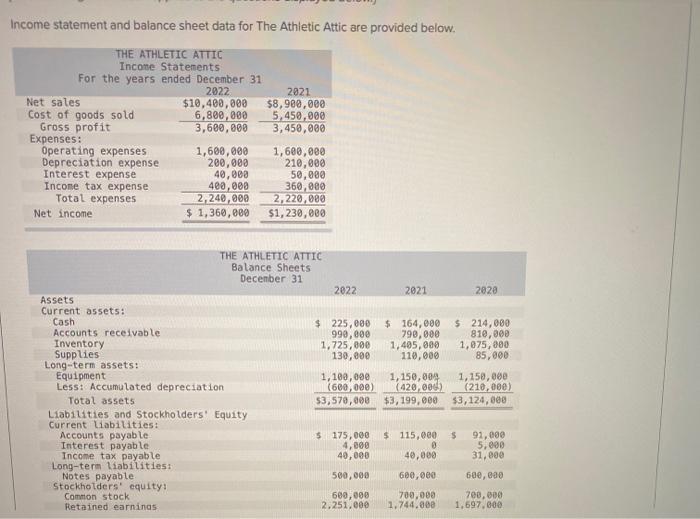
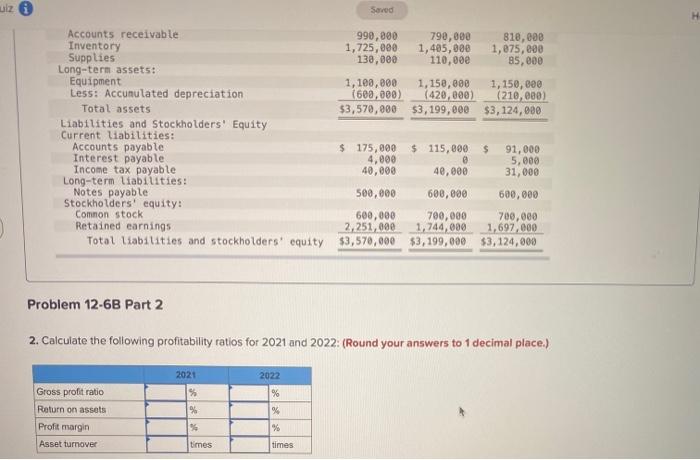
Income statement and balance sheet data for The Athletic Attic are provided below. THE ATHLETIC ATTIC Income Statements For the years ended December 31 2022 2821 Net sales $10,400,000 $8.980,000 Cost of goods sold 6,800,000 5,450,000 Gross profit 3,600,000 3,450,000 Expenses: Operating expenses 1,600,000 1,600,000 Depreciation expense 200,000 210,000 Interest expense 40,000 50,000 Income tax expense 400,000 360,000 Total expenses 2,240,000 2,220,000 Net income $ 1,360,000 $1,230,000 THE ATHLETIC ATTIC Balance Sheets December 31 2022 2021 2020 $ 225,000 999,000 1,725,000 130,000 $ 164,000 790,000 1,405,000 110,000 $ 214,000 810,000 1,075,000 85,000 Assets Current assets: Cash Accounts receivable Inventory Supplies Long-term assets: Equipment Less: Accumulated depreciation Total assets Liabilities and Stockholders' Equity Current liabilities: Accounts payable Interest payable Income tax payable Long-term liabilities: Notes payable Stockholders' equity Common stock Retained earnings 1,100,000 1,150,000 1,150,000 (600,000) (420.000) (210,000) $3,570,000 $3,199,000 $3,124,888 $ 5 175,000 4,000 40,000 $ 115,000 0 40,000 91,000 5.000 31,000 500,000 600,000 600, 600 700.000 1.697.000 600,000 2.251.000 700,000 1.744.000 Seved Accounts receivable 990,000 790,000 810,000 Inventory 1,725,000 1,405,000 1,075,000 Supplies 138,000 110,000 85,000 Long-term assets: Equipment 1,100,000 1,150,000 1,150,000 Less: Accumulated depreciation (600,000) (420,000) (210,000) Total assets $3,570,000 $3,199,000 $3,124,080 Liabilities and Stockholders' Equity Current liabilities: Accounts payable $ 175,000 $ 115,800 $ 91,000 Interest payable 4,000 @ 5,000 Income tax payable 40,000 40,000 31,000 Long-term Liabilities: Notes payable 500,000 600,000 600,000 Stockholders' equity! Common stock 600,000 700,000 700,000 Retained earnings 2,251,000 1,744,000 1,697,000 Total liabilities and stockholders' equity $3,570,000 $3,199,000 $3,124,000 Problem 12-6B Part 2 2. Calculate the following profitability ratios for 2021 and 2022: (Round your answers to 1 decimal place.) 2022 2021 % % 9 Gross profit ratio Return on assets Profit margin Asset turnover % % % times times


