Increasing promotion budgets eventually result in diminishing returns. The first one million dollars typically results in a 26% increase in awareness, while the second million results in adding another 18%, and the third million another 5%.Erie's product Eat currently has an awareness of 84%. While an important product for Erie, Eat's promotion budget will be reduced to one million dollars for the upcoming year. Assuming that Eat loses one-third of its awareness each year, what will Eat's awareness level be next year?
 Group of answer choices 82% 95% 58% 84%
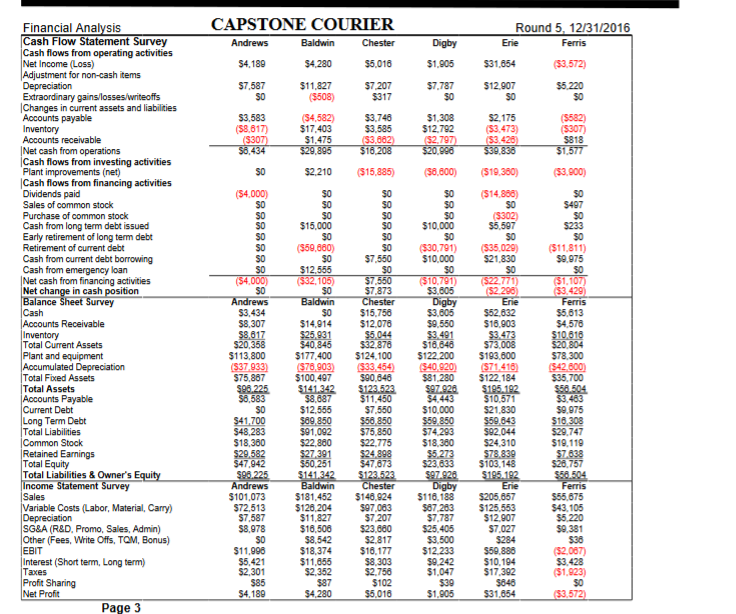
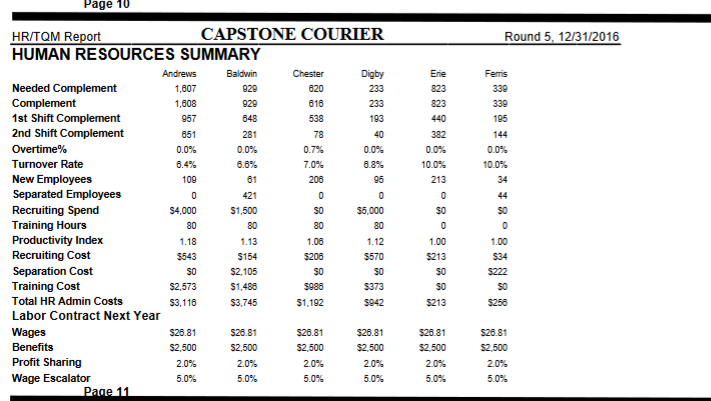
CAPSTONE COURIER Andrews Baldwin Chester $4.180 $4,280 $5,016 Digby $1,905 $7.787 SO Round 5, 12/31/2016 Erie Ferris $31.854 (53.572) $12.907 $5.220 SO SO $7,587 SO $11,827 (5508) $7.207 5317 $3,583 (58.617) ($307 $6.434 ($4,582) $17.403 $1,475 $29,895 $3.746 $3,585 ($3,662 $16.208 $2.175 (53.473) (53.420 $39.838 (519.380) (5582) (5307) $818 $1,577 (53.900) SO $2.210 ($15,885) Financial Analysis Cash Flow Statement Survey Cash flows from operating activities Net Income (Loss) Adjustment for non-cash items Depreciation Extraordinary gains/losses/writeoffs Changes in current assets and liabilities Accounts payable Inventory Accounts receivable Net cash from operations Cash flows from investing activities Plant improvements (net) Cash flows from financing activities Dividends paid Sales of common stock Purchase of common stock Cash from long term debt issued Early retirement of long term debt Retirement of current debt Cash from current debt borrowing Cash from emergency loan Net cash from financing activities Net change in cash position Balance Sheet Survey Cash Accounts Receivable Inventory Total Current Assets Plant and equipment Accumulated Depreciation Total Fixed Assets Total Assets Accounts Payable Current Debt Long Term Debt Total Liabilities Common Stock Retained Earnings Total Equity Total Liabilities & Owner's Equity Income Statement Survey Sales Variable Costs (Labor, Material, Carry) Depreciation SG&A (R&D Promo, Sales, Admin) Other (Fees, Write Offs, TOM, Bonus) EBIT Interest (Short term, Long term Taxes Profit Sharing Net Profit Page 3 (54.000) SO SO SO SO SO SO SO ($4.000) SO Andrews $3.434 $8.307 $8.617 $20.358 $113,800 ($37.933) $75,867 $98.225 $6,583 SO $41.700 $48,283 $18,360 $29.582 $47,942 $98.225 Andrews $101,073 $72,513 $7.587 $8.978 SO $11.996 $5,421 $2,301 $85 $4.189 $0 $0 SO $15.000 $0 (559,880) SO $12,555 ($82,105) SO Baldwin $0 $14.914 $25,931 $40.845 $177,400 (578,903) $100.497 $141.342 $8.687 $12,565 $89,850 $91,092 $22.860 $27391 $50,251 $141.342 Baldwin $181.452 $126,204 $11,827 $16.506 $8.542 $18,374 $11,056 $2,352 $87 $4,280 SO SO SO SO SO SO $7,550 $0 $7,550 $7.873 Chester $15.758 $12.078 $5.044 $32,878 $124,100 $33,454) $90.648 $123.522 $11.450 $7,550 $58.850 $75,850 $22.775 $24.898 $47.873 $123.523 Chester $148,924 $97.063 $7.207 $23.680 $2.817 $16.177 $8,303 $2.758 $102 $5.016 $1,308 $12.792 (52.797) $20.998 (56.600) SO $0 $0 $10.000 $0 (330,791) $10.000 $0 $10.791) $3.605 Digby $3.605 $9.550 $3.491 $16.848 $122.200 $40.920) $81,280 $97.928 $4.443 $10.000 $59.850 $74293 $18.380 $5.273 $23.633 $97.920 Digby $116,188 $87,283 $7,787 $25,405 $3,500 $12.233 59.242 $1,047 $39 $1.905 ($14,866) SO (5302 $5,597 SO ($35.029) $21,830 SO $22.771) (52.296 Ere $52.632 $16.903 $3.473 $73,008 $193.600 (571.416 $122.184 $195.192 $10.571 $21,830 $59.643 S92.044 $24.310 $78,839 $103.148 $195.192 Ene $205,657 $125,553 $12.907 $7,027 $284 $59,888 $10.194 $17,392 $846 $31,654 $0 $497 $0 $233 $0 ($11.811) $9.975 $0 $1,107) $3.429) Ferris $5,613 $4.578 $10.610 $20.804 $78,300 (542 800) $35,700 $68.504 $3.463 59.975 $16.308 $29.747 $19.119 $7633 $28,757 $50.504 Ferris $55.675 $43.106 $5.220 59.381 $36 ($2.087) $3.428 ($1.923) $0 53.572) Page 10 Round 5, 12/31/2016 Erie 823 823 440 382 0.0% 10.0% 213 208 HR/TOM Report CAPSTONE COURIER HUMAN RESOURCES SUMMARY Andrews Baldwin Chester Digby Needed Complement 1,607 929 620 233 Complement 1.608 929 616 233 1st Shift Complement 957 848 538 193 2nd Shift Complement 851 281 78 40 Overtime% 0.0% 0.0% 0.7% 0.0% Turnover Rate 6.6% 7.0% 6.8% New Employees 100 61 95 Separated Employees 0 421 0 0 Recruiting Spend $4,000 $1,500 SO $5,000 Training Hours 80 80 80 80 Productivity Index 1.18 1.13 1.08 1.12 Recruiting Cost $543 $154 $200 $570 Separation Cost SO $2.105 SO SO Training Cost $2,573 $1.480 1986 $373 Total HR Admin Costs $3,116 $3.745 $1,192 5942 Labor Contract Next Year Wages $26.81 $28.81 $28.81 $26.81 Benefits $2,500 $2,500 $2,500 $2.500 Profit Sharing 2.0% 2.0% 2.0% 2.0% Wage Escalator 5.0% 5.0% 5.0% 5.0% Page 11 Ferris 339 339 195 144 0.0% 10.0% 34 44 SO 0 1.00 $34 $222 50 $250 0 1.00 $213 SO $213 $26.81 $2.500 2.0% 5.0% $26.81 $2.500 20% 5.0% CAPSTONE COURIER Andrews Baldwin Chester $4.180 $4,280 $5,016 Digby $1,905 $7.787 SO Round 5, 12/31/2016 Erie Ferris $31.854 (53.572) $12.907 $5.220 SO SO $7,587 SO $11,827 (5508) $7.207 5317 $3,583 (58.617) ($307 $6.434 ($4,582) $17.403 $1,475 $29,895 $3.746 $3,585 ($3,662 $16.208 $2.175 (53.473) (53.420 $39.838 (519.380) (5582) (5307) $818 $1,577 (53.900) SO $2.210 ($15,885) Financial Analysis Cash Flow Statement Survey Cash flows from operating activities Net Income (Loss) Adjustment for non-cash items Depreciation Extraordinary gains/losses/writeoffs Changes in current assets and liabilities Accounts payable Inventory Accounts receivable Net cash from operations Cash flows from investing activities Plant improvements (net) Cash flows from financing activities Dividends paid Sales of common stock Purchase of common stock Cash from long term debt issued Early retirement of long term debt Retirement of current debt Cash from current debt borrowing Cash from emergency loan Net cash from financing activities Net change in cash position Balance Sheet Survey Cash Accounts Receivable Inventory Total Current Assets Plant and equipment Accumulated Depreciation Total Fixed Assets Total Assets Accounts Payable Current Debt Long Term Debt Total Liabilities Common Stock Retained Earnings Total Equity Total Liabilities & Owner's Equity Income Statement Survey Sales Variable Costs (Labor, Material, Carry) Depreciation SG&A (R&D Promo, Sales, Admin) Other (Fees, Write Offs, TOM, Bonus) EBIT Interest (Short term, Long term Taxes Profit Sharing Net Profit Page 3 (54.000) SO SO SO SO SO SO SO ($4.000) SO Andrews $3.434 $8.307 $8.617 $20.358 $113,800 ($37.933) $75,867 $98.225 $6,583 SO $41.700 $48,283 $18,360 $29.582 $47,942 $98.225 Andrews $101,073 $72,513 $7.587 $8.978 SO $11.996 $5,421 $2,301 $85 $4.189 $0 $0 SO $15.000 $0 (559,880) SO $12,555 ($82,105) SO Baldwin $0 $14.914 $25,931 $40.845 $177,400 (578,903) $100.497 $141.342 $8.687 $12,565 $89,850 $91,092 $22.860 $27391 $50,251 $141.342 Baldwin $181.452 $126,204 $11,827 $16.506 $8.542 $18,374 $11,056 $2,352 $87 $4,280 SO SO SO SO SO SO $7,550 $0 $7,550 $7.873 Chester $15.758 $12.078 $5.044 $32,878 $124,100 $33,454) $90.648 $123.522 $11.450 $7,550 $58.850 $75,850 $22.775 $24.898 $47.873 $123.523 Chester $148,924 $97.063 $7.207 $23.680 $2.817 $16.177 $8,303 $2.758 $102 $5.016 $1,308 $12.792 (52.797) $20.998 (56.600) SO $0 $0 $10.000 $0 (330,791) $10.000 $0 $10.791) $3.605 Digby $3.605 $9.550 $3.491 $16.848 $122.200 $40.920) $81,280 $97.928 $4.443 $10.000 $59.850 $74293 $18.380 $5.273 $23.633 $97.920 Digby $116,188 $87,283 $7,787 $25,405 $3,500 $12.233 59.242 $1,047 $39 $1.905 ($14,866) SO (5302 $5,597 SO ($35.029) $21,830 SO $22.771) (52.296 Ere $52.632 $16.903 $3.473 $73,008 $193.600 (571.416 $122.184 $195.192 $10.571 $21,830 $59.643 S92.044 $24.310 $78,839 $103.148 $195.192 Ene $205,657 $125,553 $12.907 $7,027 $284 $59,888 $10.194 $17,392 $846 $31,654 $0 $497 $0 $233 $0 ($11.811) $9.975 $0 $1,107) $3.429) Ferris $5,613 $4.578 $10.610 $20.804 $78,300 (542 800) $35,700 $68.504 $3.463 59.975 $16.308 $29.747 $19.119 $7633 $28,757 $50.504 Ferris $55.675 $43.106 $5.220 59.381 $36 ($2.087) $3.428 ($1.923) $0 53.572) Page 10 Round 5, 12/31/2016 Erie 823 823 440 382 0.0% 10.0% 213 208 HR/TOM Report CAPSTONE COURIER HUMAN RESOURCES SUMMARY Andrews Baldwin Chester Digby Needed Complement 1,607 929 620 233 Complement 1.608 929 616 233 1st Shift Complement 957 848 538 193 2nd Shift Complement 851 281 78 40 Overtime% 0.0% 0.0% 0.7% 0.0% Turnover Rate 6.6% 7.0% 6.8% New Employees 100 61 95 Separated Employees 0 421 0 0 Recruiting Spend $4,000 $1,500 SO $5,000 Training Hours 80 80 80 80 Productivity Index 1.18 1.13 1.08 1.12 Recruiting Cost $543 $154 $200 $570 Separation Cost SO $2.105 SO SO Training Cost $2,573 $1.480 1986 $373 Total HR Admin Costs $3,116 $3.745 $1,192 5942 Labor Contract Next Year Wages $26.81 $28.81 $28.81 $26.81 Benefits $2,500 $2,500 $2,500 $2.500 Profit Sharing 2.0% 2.0% 2.0% 2.0% Wage Escalator 5.0% 5.0% 5.0% 5.0% Page 11 Ferris 339 339 195 144 0.0% 10.0% 34 44 SO 0 1.00 $34 $222 50 $250 0 1.00 $213 SO $213 $26.81 $2.500 2.0% 5.0% $26.81 $2.500 20% 5.0%