

Answered step by step
Verified Expert Solution
Question
1 Approved Answer
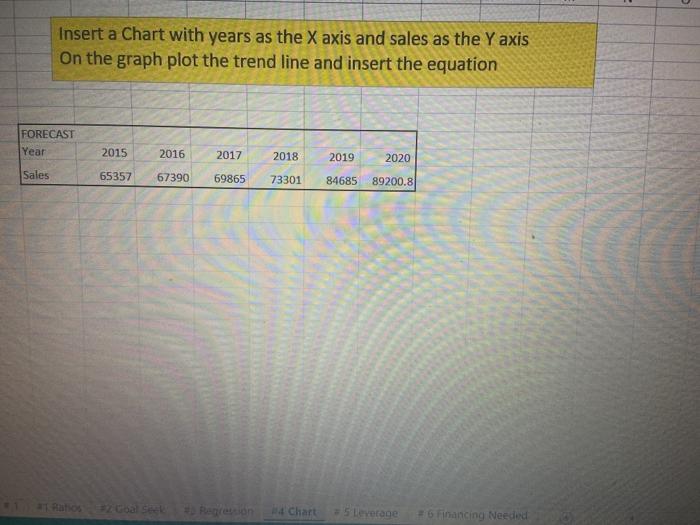
Insert a Chart with years as the X axis and sales as the Y axis On the graph plot the trend line and insert the
Step by Step Solution
There are 3 Steps involved in it
Step: 1

Get Instant Access to Expert-Tailored Solutions
See step-by-step solutions with expert insights and AI powered tools for academic success
Step: 2

Step: 3
Ace Your Homework with AI
Get the answers you need in no time with our AI-driven, step-by-step assistance
Get Started
Tax Audit Approach And Due Diligence Related To Tax Credits
Authors: Mohamed Ben Sassi
1st Edition
6204246941, 978-6204246949