Answered step by step
Verified Expert Solution
Question
1 Approved Answer
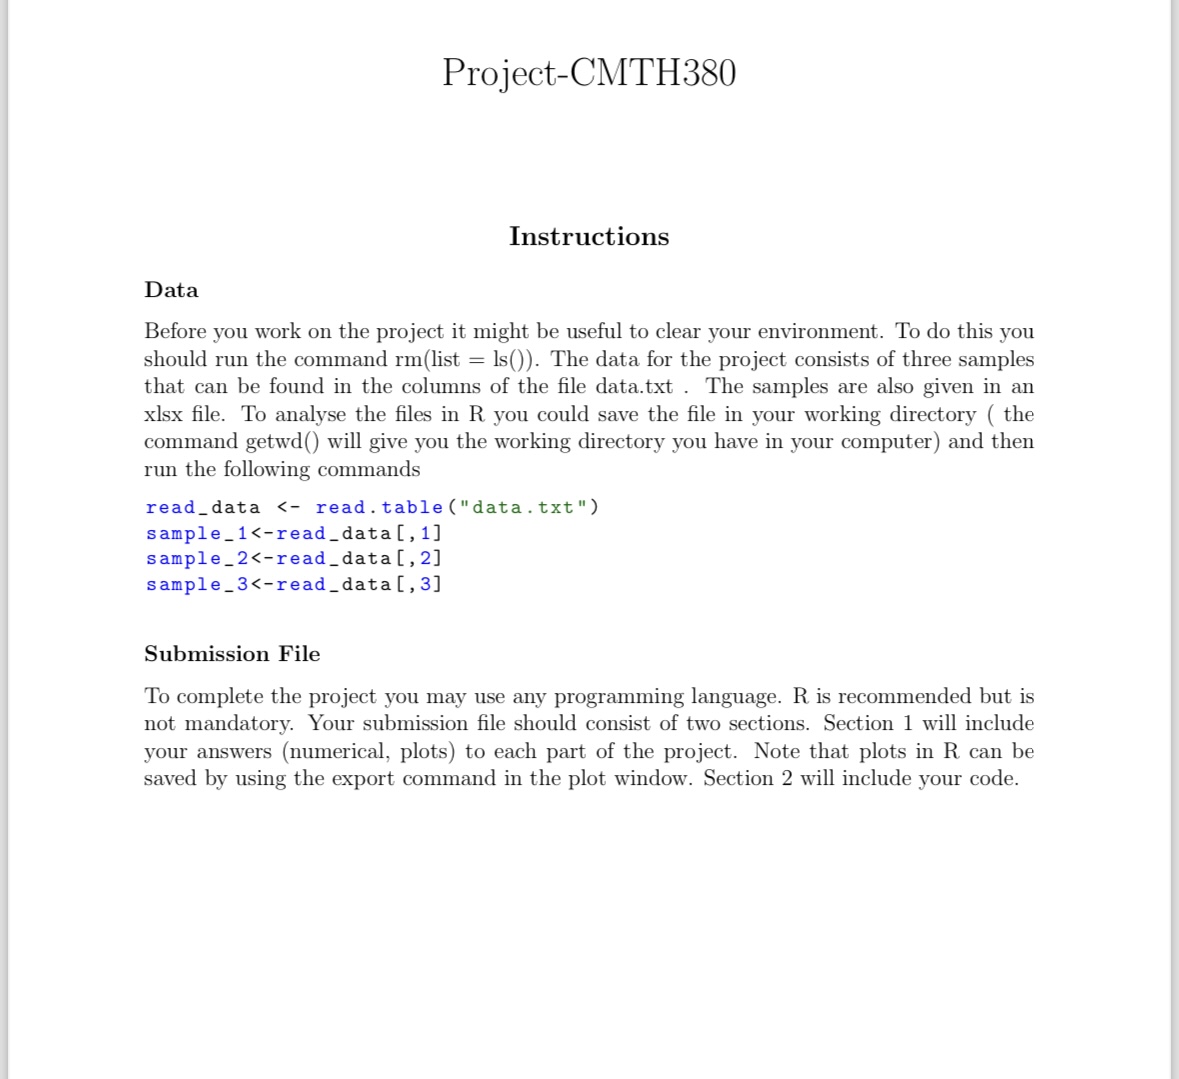
Instructions Data Before you work on the project it might be useful to clear your environment. To do this you should run the command r
Instructions
Data
Before you work on the project it might be useful to clear your environment. To do this you
should run the command The data for the project consists of three samples
that can be found in the columns of the file data.txt The samples are also given in an
xlsx file. To analyse the files in R you could save the file in your working directory the
command getwd will give you the working directory you have in your computer and then
run the following commandssamplereaddata
samplereaddata
samplereaddataSubmission File
To complete the project you may use any programming language. R is recommended but is
not mandatory. Your submission file should consist of two sections. Section will include
your answers numerical plots to each part of the project. Note that plots in R can be
saved by using the export command in the plot window. Section will include your code. Problems
Part A
For each sample, plot the histogram and calculate the sample mean and sample variance.
One of the samples is drawn from a normal distribution, determine which.
Part B
Sample is drawn from a population with unknown mean and variance. Based on sample
Calculate the two sided confidence intervals on the mean of the population.
Find the P value of the test : vs :
Part C
Sample is drawn from the production of a manufacture company. The value in the data
represents a non defective part and the value represents a defective part. The company
wants to demonstrate that the defective parts are less that of their production. Perform
a suitable hypothesis test to demonstrate this claim.
Usefull R commands: hist, mean, length, qqnorm, var, sum, pnorm, qt pchisq

Step by Step Solution
There are 3 Steps involved in it
Step: 1

Get Instant Access to Expert-Tailored Solutions
See step-by-step solutions with expert insights and AI powered tools for academic success
Step: 2

Step: 3

Ace Your Homework with AI
Get the answers you need in no time with our AI-driven, step-by-step assistance
Get Started


