Instructions: First, solve the problems without using Minitab, and then develop also Minitab solution (where appropriate). Submit both. dark 1. A design engineer would like
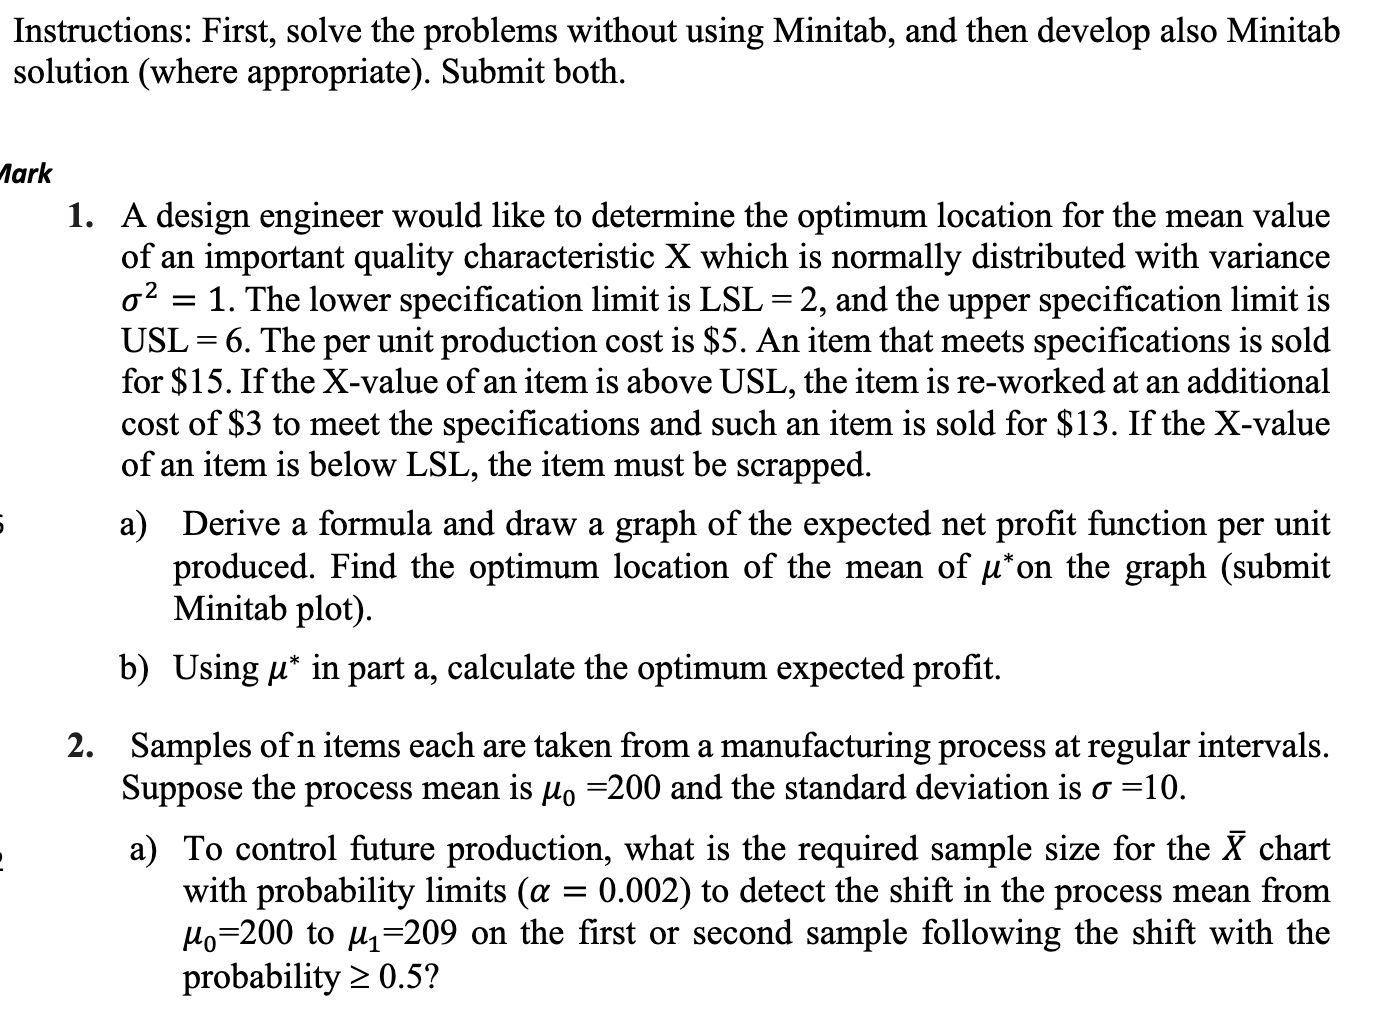
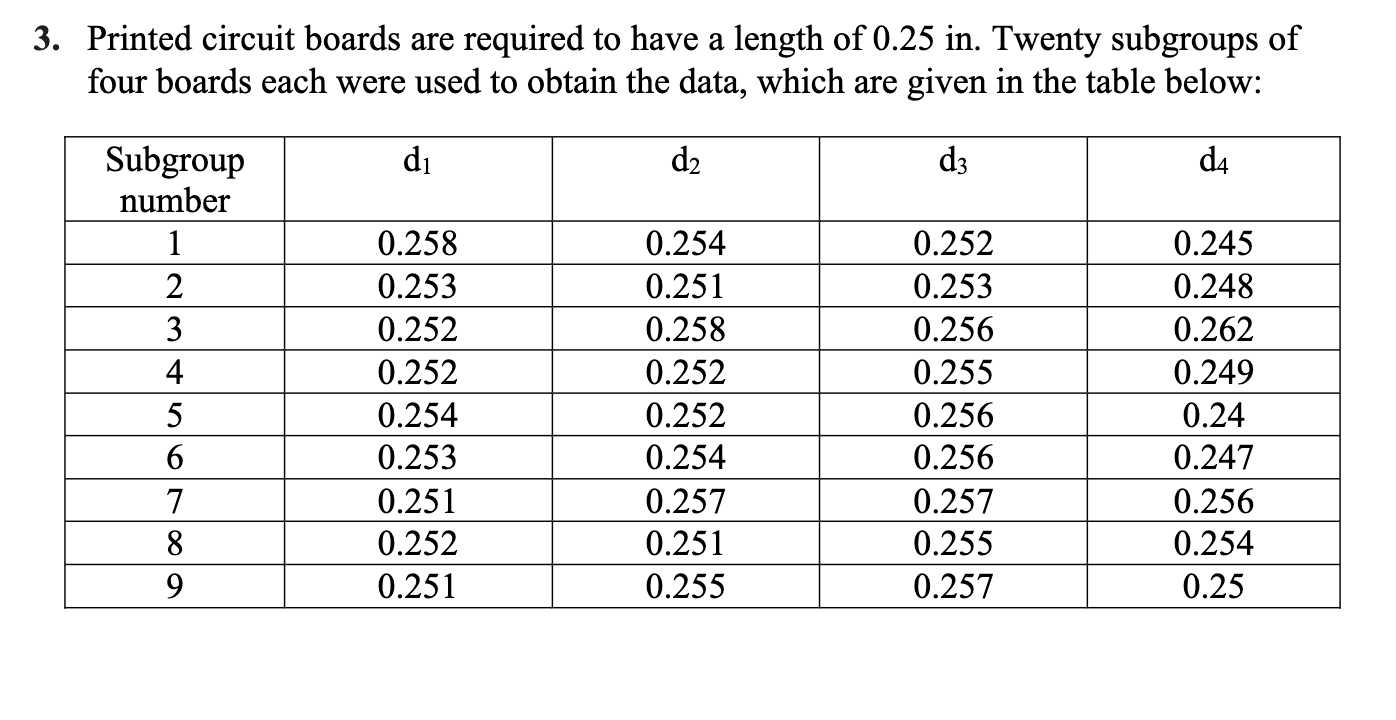
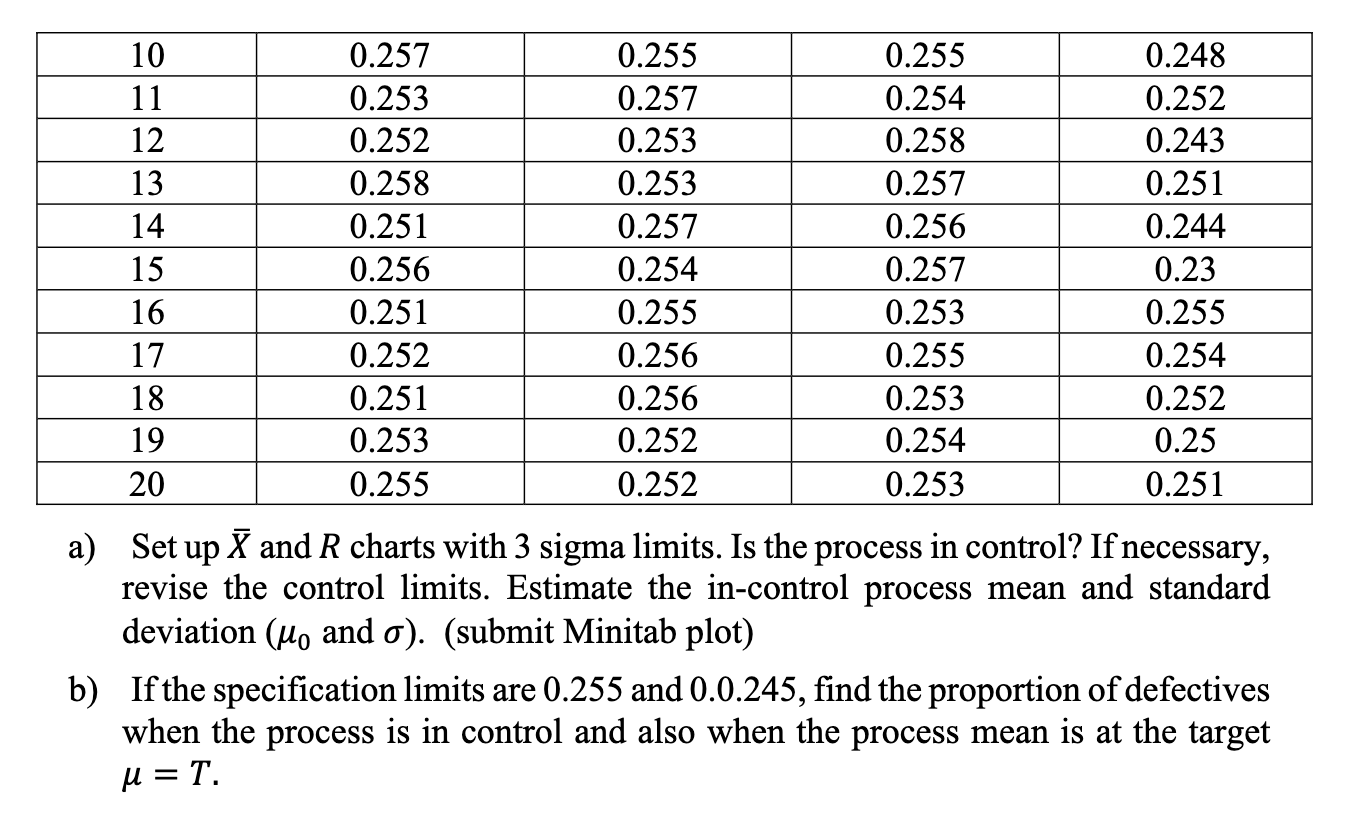
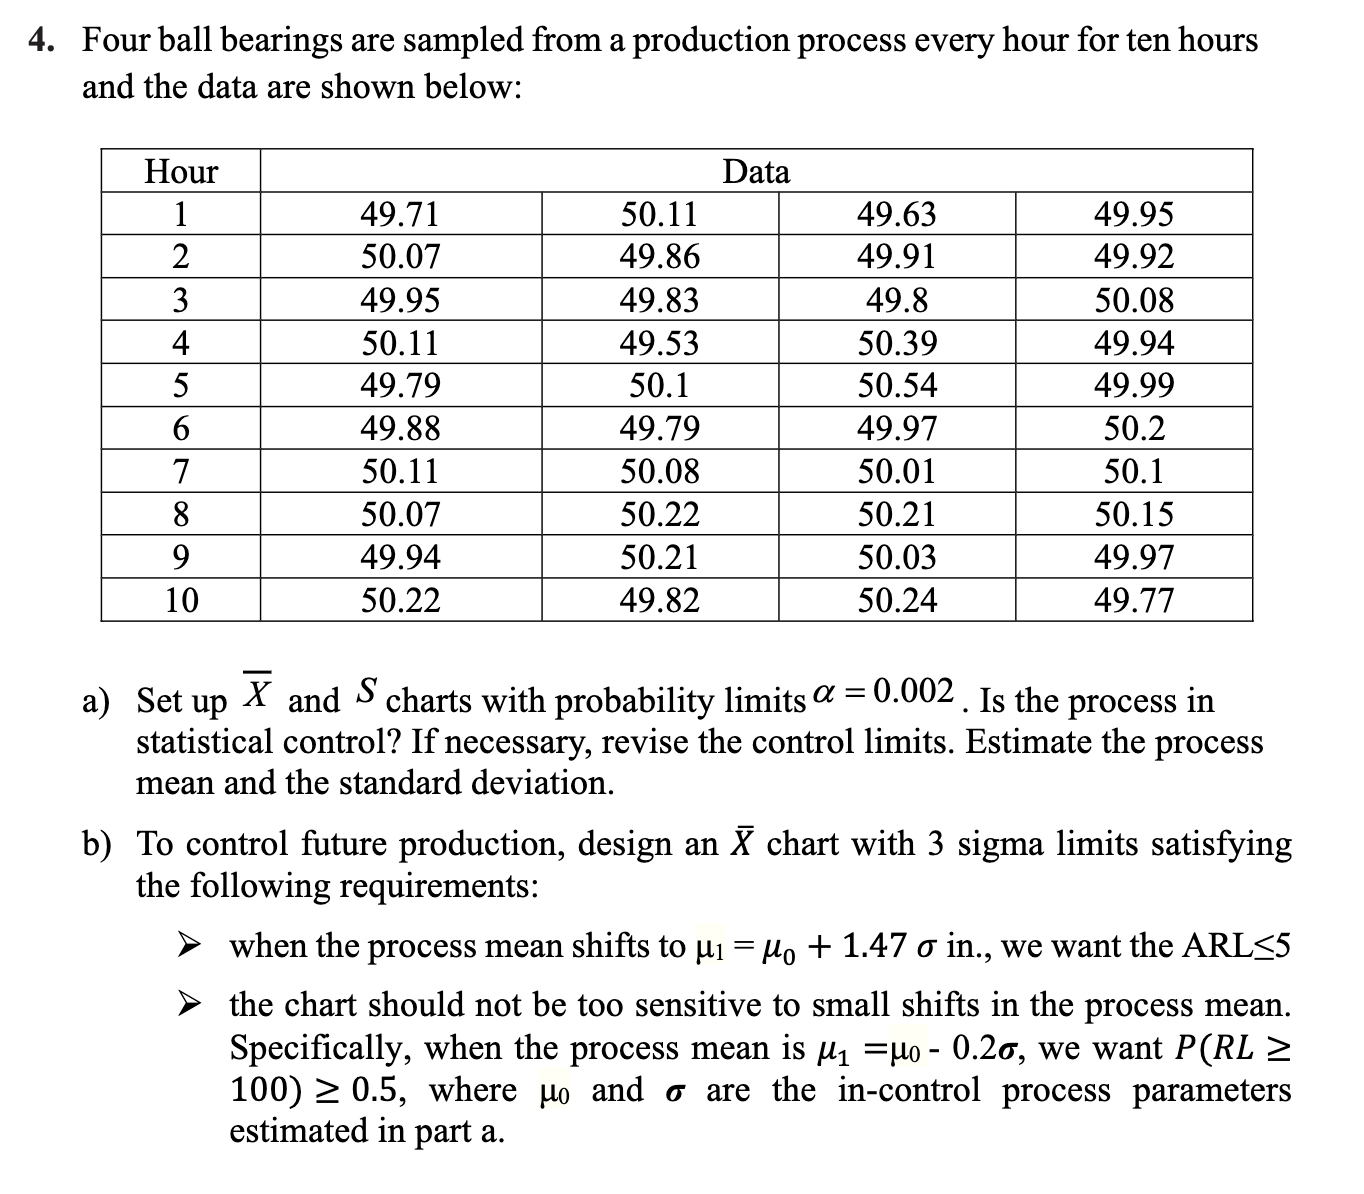
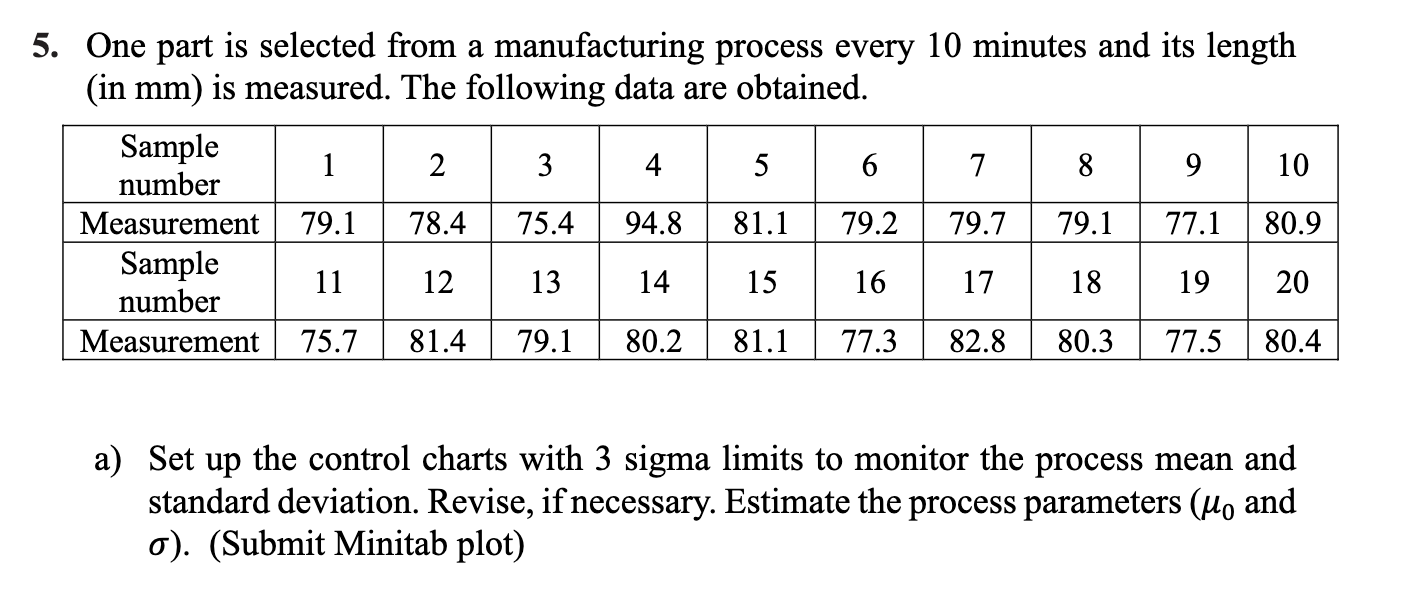
Instructions: First, solve the problems without using Minitab, and then develop also Minitab solution (where appropriate). Submit both. dark 1. A design engineer would like to determine the optimum location for the mean value of an important quality characteristic X which is normally distributed with variance 02 = 1. The lower specification limit is LSL = 2, and the upper specication limit is USL = 6. The per unit production cost is $5. An item that meets specications is sold for $15. If the X-value of an item is above USL, the item is re-worked at an additional cost of $3 to meet the specications and such an item is sold for $13. If the X-value of an item is below LSL, the item must be scrapped. i a) Derive a formula and draw a graph of the expected net prot function per unit produced. Find the optimum location of the mean of Won the graph (submit Minitab plot). b) Using it" in part a, calculate the optimum expected prot. 2. Samples of 11 items each are taken from a manufacturing process at regular intervals. Suppose the process mean is no =200 and the standard deviation is 0 =10. 1 a) To control future production, what is the required sample size for the X chart with probability limits (or = 0.002) to detect the shift in the process mean from po=200 to [11:209 on the rst or second sample following the shift with the probability 2 0.5? 3. Printed circuit boards are required to have a length of 0.25 in. Twenty subgroups of four boards each were used to obtain the data, which are given in the table below: 10 0.257 0.255 0.255 0.248 11 0.253 0.257 0.254 0.252 12 0.252 0.253 0.258 0.243 13 0.258 0.253 0.257 0.251 14 0.251 0.257 0.256 0.244 15 0.256 0.254 0.257 0.23 16 0.251 0.255 0.253 0.255 17 0.252 0.256 0.255 0.254 18 0.251 0.256 0.253 0.252 19 0.253 0.252 0.254 0.25 20 0.255 0.252 0.253 0.251 a) Set up X and R charts with 3 sigma limits. Is the process in control? If necessary, revise the control limits. Estimate the in-control process mean and standard deviation (Mo and o). (submit Minitab plot) b) If the specification limits are 0.255 and 0.0.245, find the proportion of defectives when the process is in control and also when the process mean is at the target u = T.4. Four ball bearings are sampled from a production process every hour for ten hours and the data are shown below: 7 um um I. _ a) Set up X and S charts with probability limits as = 0002. Is the process in statistical control? If necessary, revise the control limits. Estimate the process mean and the standard deviation. b) To control lture production, design an X chart with 3 sigma limits satisfying the following requirements: > when the process mean shifts to p1 = no + 1.4-7 0 in., we want the ARLSS > the chart should not be too sensitive to small shifts in the process mean. Specically, when the process mean is #1 =uo - 0.26, we want P(RL 2 100) 2 0.5, where no and a- are the incontrol process parameters estimated in part a. 5. One part is selected from a manufacturing process every 10 minutes and its length (in mm) is measured. The following data are obtained. Sample 2 W 4 number 5 6 8 10 Measurement 79.1 78.4 75.4 94.8 81.1 79.2 79.7 79.1 77.1 80.9 Sample 11 12 13 14 number 15 16 17 18 19 20 Measurement 75.7 81.4 79.1 80.2 81.1 77.3 82.8 80.3 77.5 80.4 a) Set up the control charts with 3 sigma limits to monitor the process mean and standard deviation. Revise, if necessary. Estimate the process parameters (Mo and "). (Submit Minitab plot)
Step by Step Solution
There are 3 Steps involved in it
Step: 1
Get Instant Access to Expert-Tailored Solutions
See step-by-step solutions with expert insights and AI powered tools for academic success
Step: 2
Step: 3
Ace Your Homework with AI
Get the answers you need in no time with our AI-driven, step-by-step assistance