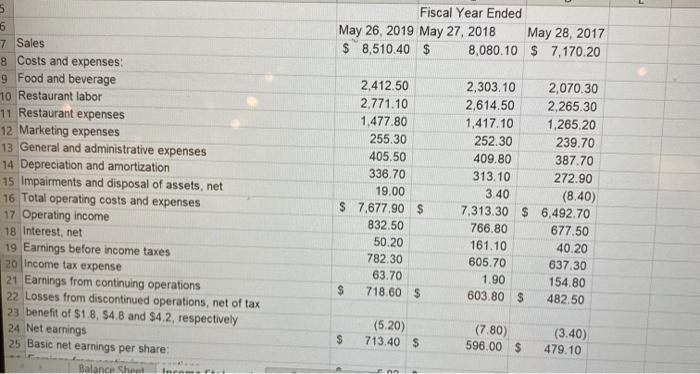
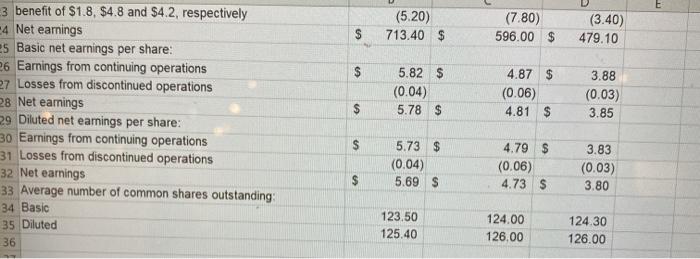
Instructions Task 3: Common-size and Comparative Analysis Follow the format of the attached example to conduct these two analyses for both balance sheet and income statement for all three years. 6 7 Sales Fiscal Year Ended May 26, 2019 May 27, 2018 May 28, 2017 $ 8,510.40 $ 8,080.10 $ 7.170.20 8 Costs and expenses 9 Food and beverage 10 Restaurant labor 11 Restaurant expenses 12 Marketing expenses 13 General and administrative expenses 14 Depreciation and amortization 15 Impairments and disposal of assets, net 16 Total operating costs and expenses 17 Operating income 18 Interest, net 19 Earnings before income taxes 20 Income tax expense 21 Earnings from continuing operations 22 Losses from discontinued operations, net of tax 23 benefit of $1.8, 54.8 and 94.2, respectively 24 Net earnings 25 Basic net earnings per share: Balance Sheet 2,412.50 2,771.10 1,477.80 255.30 405,50 336.70 19.00 $ 7,677.90 $ 832.50 50.20 782.30 63.70 $ 718.60 $ 2,303.10 2,070.30 2,614.50 2,265.30 1,417.10 1,265,20 252.30 239.70 409.80 387.70 313.10 272.90 3.40 (8,40) 7.313.30 $ 6,492.70 766.80 677.50 161.10 40.20 605.70 637.30 1.90 154.80 603.80 $ 482.50 (5.20) 713.40 $ $ (7.80) 596.00 $ (3.40) 479.10 (5.20) 713.40 $ $ (7.80) 596.00 $ (3.40) 479.10 $ 5.82 $ (0.04) 5.78 $ 4.87 $ (0.06) 4.81 $ 3.88 (0.03) 3.85 $ $ 3 benefit of $1.8. $4.8 and $4.2, respectively -4 Net earnings 5 Basic net earnings per share: 26 Earnings from continuing operations 27 Losses from discontinued operations 28 Net eamings 29 Diluted net earnings per share: 30 Earnings from continuing operations 31 Losses from discontinued operations 32 Net earnings 33 Average number of common shares outstanding: 34 Basic 35 Diluted 36 S 5.73 $ (0.04) 5.69 $ 4.79 $ (0.06) 4.73 $ 3.83 (0.03) 3.80 123.50 125.40 124.00 126.00 124.30 126.00