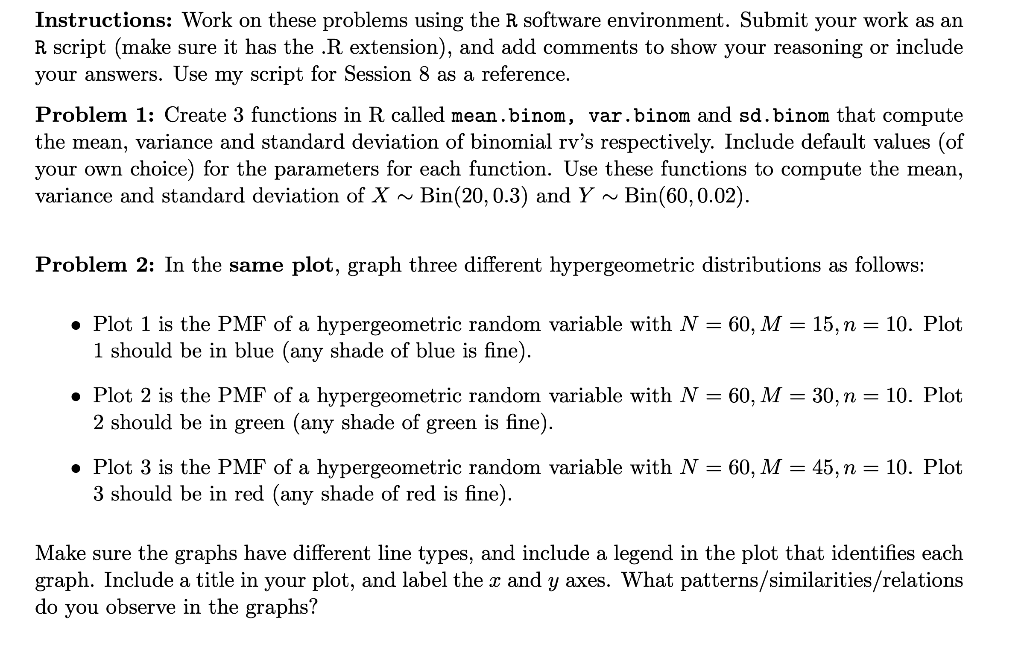
Instructions: Work on these problems using the R software environment. Submit your work as an R script (make sure it has the .R extension), and add comments to show your reasoning or include your answers. Use my script for Session 8 as a reference. Problem 1: Create 3 functions in R called mean.binom, var.binom and sd.binom that compute the mean, variance and standard deviation of binomial rv's respectively. Include default values (of your own choice for the parameters for each function. Use these functions to compute the mean, variance and standard deviation of X ~ Bin(20,0.3) and Y ~ Bin(60, 0.02). Problem 2: In the same plot, graph three different hypergeometric distributions as follows: Plot 1 is the PMF of a hypergeometric random variable with N = 60, M = 15, n = 10. Plot 1 should be in blue (any shade of blue is fine). Plot 2 is the PMF of a hypergeometric random variable with N = 60, M = 30, n = 10. Plot 2 should be in green (any shade of green is fine). Plot 3 is the PMF of a hypergeometric random variable with N = 60, M = 45, n = 10. Plot 3 should be in red (any shade of red is fine). Make sure the graphs have different line types, and include a legend in the plot that identifies each graph. Include a title in your plot, and label the x and y axes. What patterns/similarities/relations do you observe in the graphs? Instructions: Work on these problems using the R software environment. Submit your work as an R script (make sure it has the .R extension), and add comments to show your reasoning or include your answers. Use my script for Session 8 as a reference. Problem 1: Create 3 functions in R called mean.binom, var.binom and sd.binom that compute the mean, variance and standard deviation of binomial rv's respectively. Include default values (of your own choice for the parameters for each function. Use these functions to compute the mean, variance and standard deviation of X ~ Bin(20,0.3) and Y ~ Bin(60, 0.02). Problem 2: In the same plot, graph three different hypergeometric distributions as follows: Plot 1 is the PMF of a hypergeometric random variable with N = 60, M = 15, n = 10. Plot 1 should be in blue (any shade of blue is fine). Plot 2 is the PMF of a hypergeometric random variable with N = 60, M = 30, n = 10. Plot 2 should be in green (any shade of green is fine). Plot 3 is the PMF of a hypergeometric random variable with N = 60, M = 45, n = 10. Plot 3 should be in red (any shade of red is fine). Make sure the graphs have different line types, and include a legend in the plot that identifies each graph. Include a title in your plot, and label the x and y axes. What patterns/similarities/relations do you observe in the graphs


