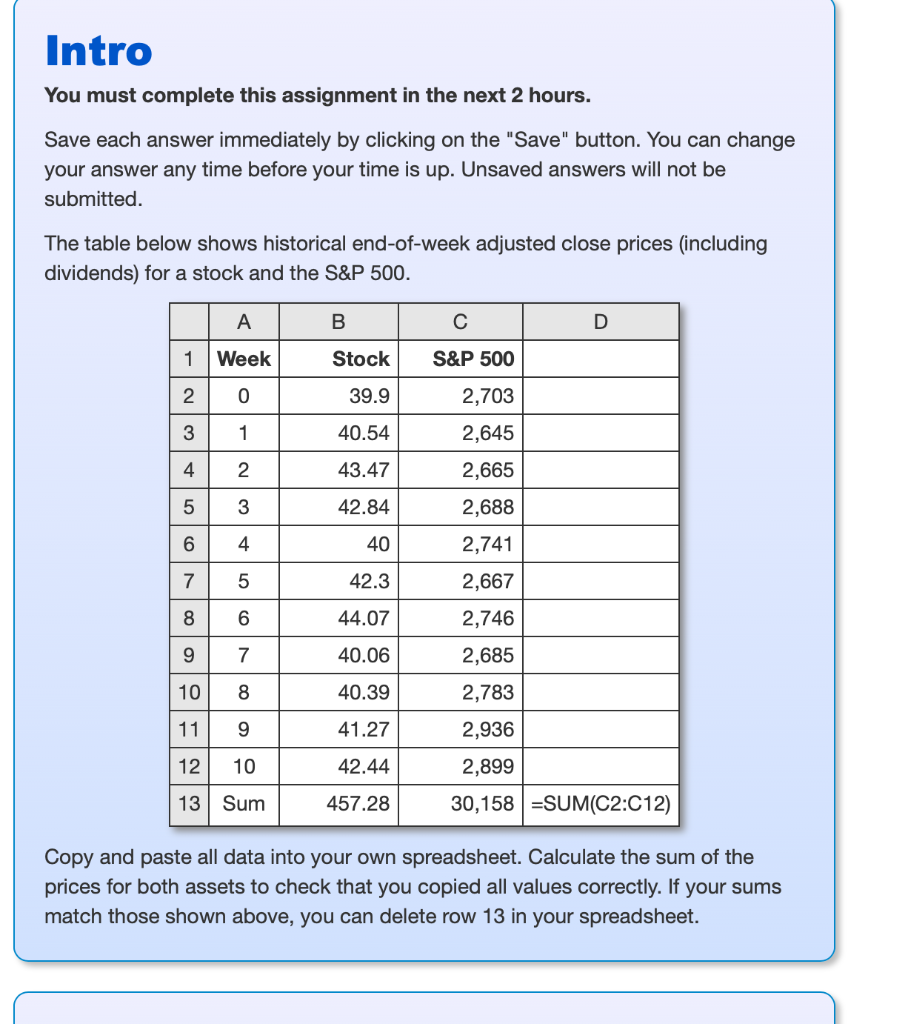
Intro You must complete this assignment in the next 2 hours. Save each answer immediately by clicking on the "Save" button. You can change your answer any time before your time is up. Unsaved answers will not be submitted. The table below shows historical end-of-week adjusted close prices (including dividends) for a stock and the S&P 500. A B D 1 Week Stock S&P 500 2 0 39.9 2,703 3 1 40.54 2,645 4 2 43.47 2,665 5 3 42.84 2,688 6 4 40 2,741 5 42.3 2,667 6 44.07 2,746 7 40.06 2,685 10 8 40.39 2,783 11 9 41.27 2,936 12 10 42.44 2,899 13 Sum 457.28 30,158 SUM(C2:C12) Copy and paste all data into your own spreadsheet. Calculate the sum of the prices for both assets to check that you copied all values correctly. If your sums match those shown above, you can delete row 13 in your spreadsheet. Part 7 Attempt 1/1 For the next few parts, assume a portfolio of 60% stock and 40% S&P 500. If you rebalanced such a portfolio every week to keep the weights at 0.6/0.4, what was the holding period return over the 10 weeks for the portfolio? 3+ decimals Save Part 8 Attempt 1/1 What is the standard deviation of weekly returns for such a portfolio if you rebalanced every week? 4+ decimals Save Part 9 What is the beta of such a portfolio if you rebalanced every week? 3+ decimals Save Attempt 1/1 Intro You must complete this assignment in the next 2 hours. Save each answer immediately by clicking on the "Save" button. You can change your answer any time before your time is up. Unsaved answers will not be submitted. The table below shows historical end-of-week adjusted close prices (including dividends) for a stock and the S&P 500. A B D 1 Week Stock S&P 500 2 0 39.9 2,703 3 1 40.54 2,645 4 2 43.47 2,665 5 3 42.84 2,688 6 4 40 2,741 5 42.3 2,667 6 44.07 2,746 7 40.06 2,685 10 8 40.39 2,783 11 9 41.27 2,936 12 10 42.44 2,899 13 Sum 457.28 30,158 SUM(C2:C12) Copy and paste all data into your own spreadsheet. Calculate the sum of the prices for both assets to check that you copied all values correctly. If your sums match those shown above, you can delete row 13 in your spreadsheet. Part 7 Attempt 1/1 For the next few parts, assume a portfolio of 60% stock and 40% S&P 500. If you rebalanced such a portfolio every week to keep the weights at 0.6/0.4, what was the holding period return over the 10 weeks for the portfolio? 3+ decimals Save Part 8 Attempt 1/1 What is the standard deviation of weekly returns for such a portfolio if you rebalanced every week? 4+ decimals Save Part 9 What is the beta of such a portfolio if you rebalanced every week? 3+ decimals Save Attempt 1/1