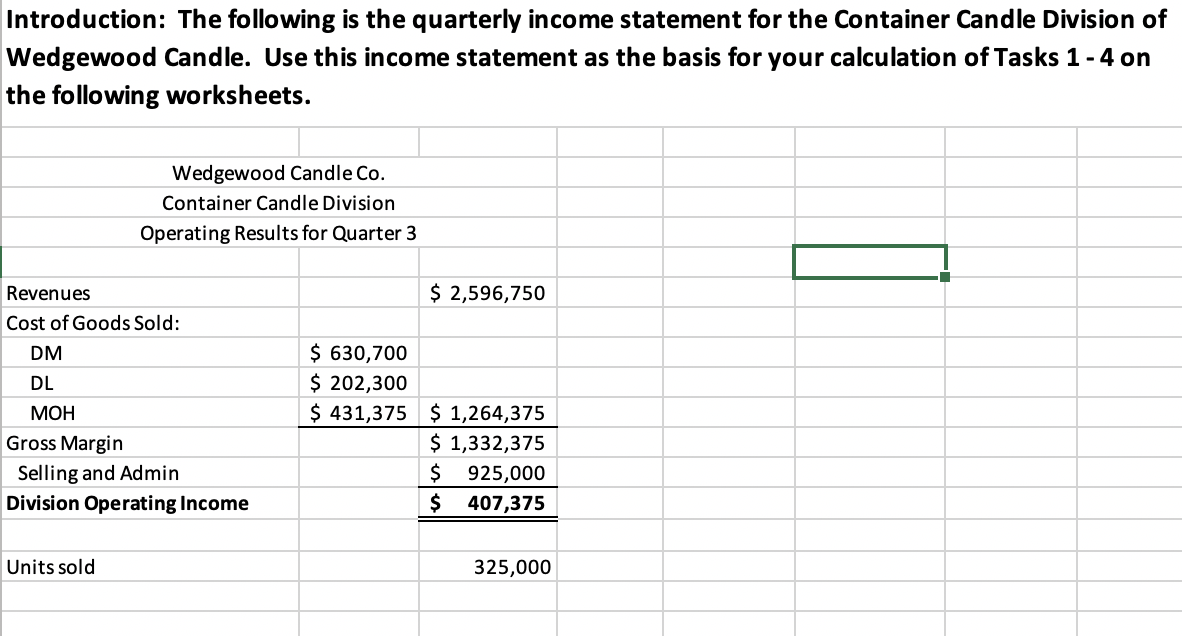
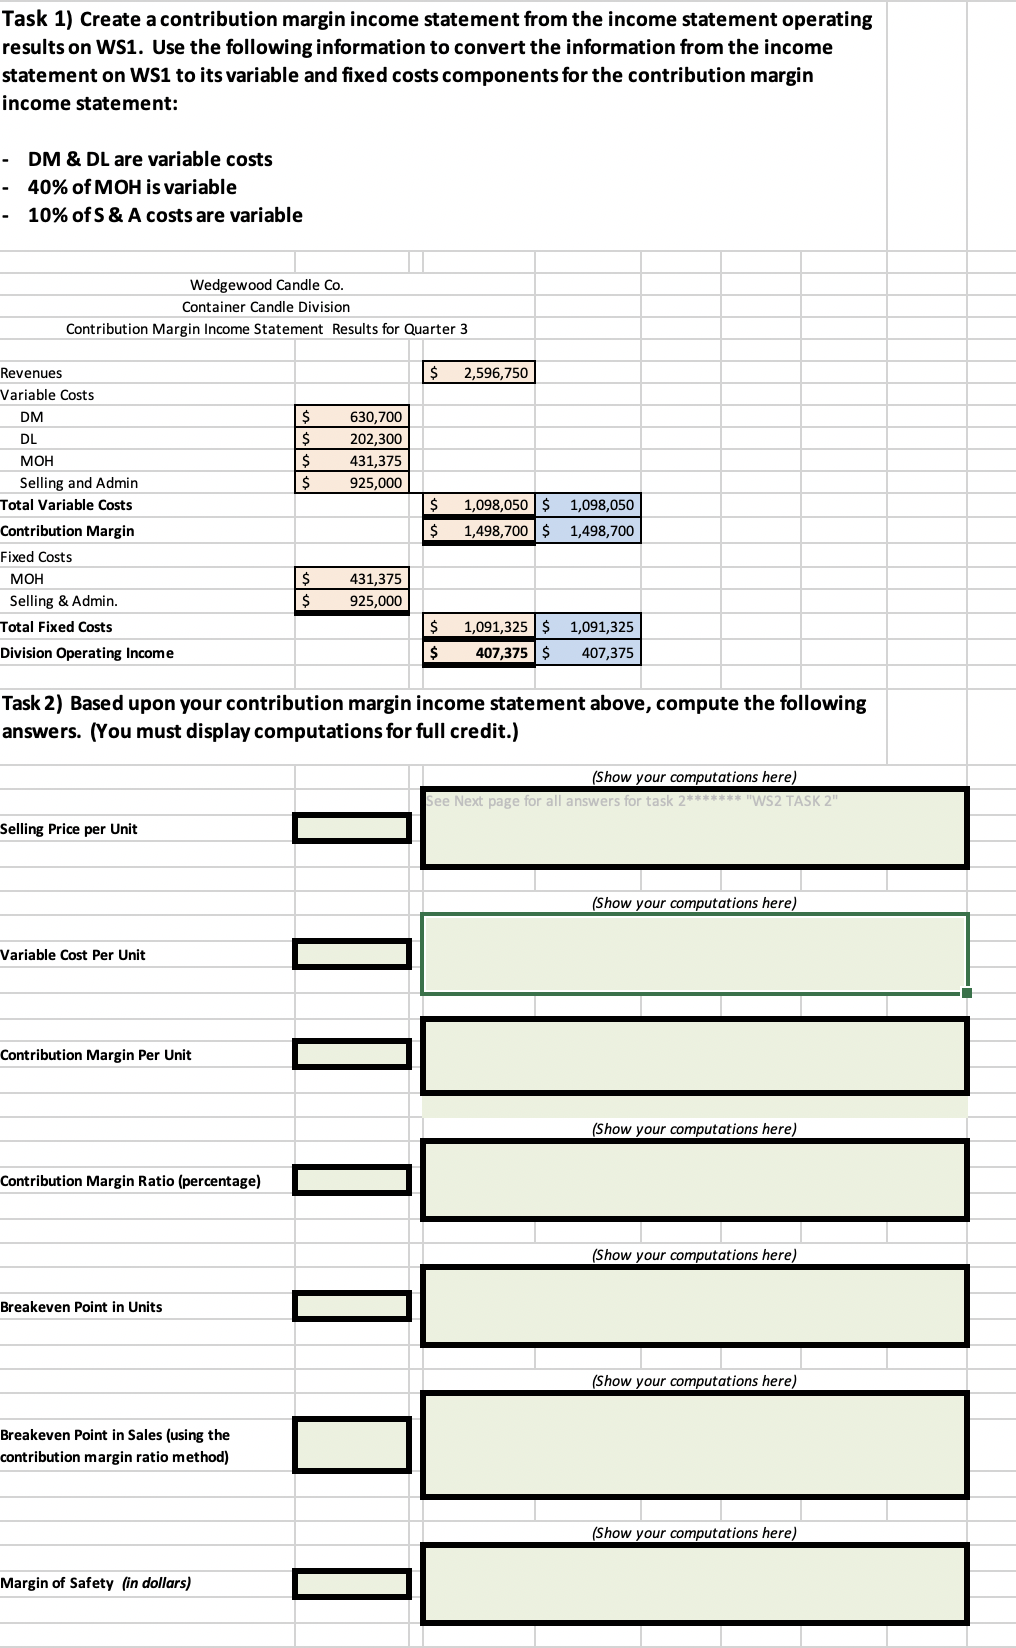
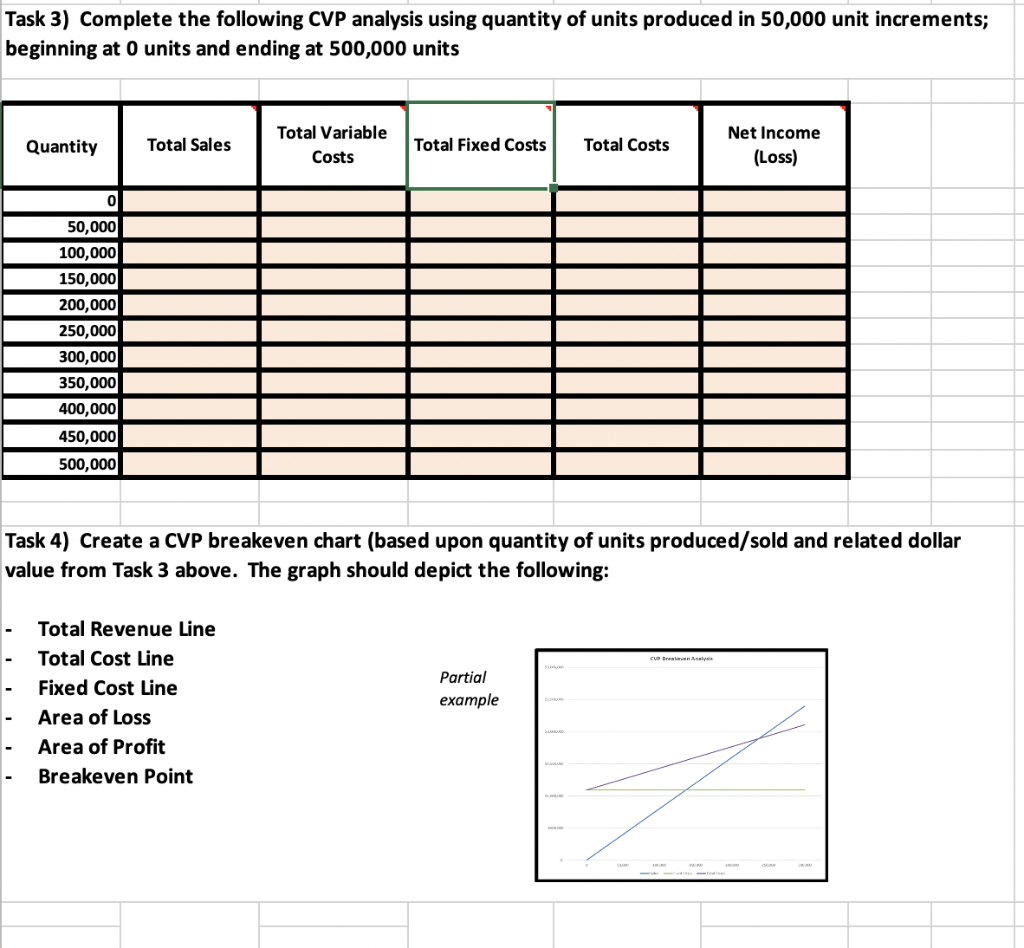
Introduction: The following is the quarterly income statement for the Container Candle Division of Wedgewood Candle. Use this income statement as the basis for your calculation of Tasks 1 - 4 on the following worksheets. Wedgewood Candle Co. Container Candle Division Operating Results for Quarter 3 $ 2,596,750 Revenues Cost of Goods Sold: DM DL MOH Gross Margin Selling and Admin Division Operating Income $ 630,700 $ 202,300 $ 431,375 $ 1,264,375 $ 1,332,375 $ 925,000 $ 407,375 Units sold 325,000 Task 1) Create a contribution margin income statement from the income statement operating results on WS1. Use the following information to convert the information from the income statement on WS1 to its variable and fixed costs components for the contribution margin income statement: DM & DL are variable costs 40% of MOH is variable 10% of S & A costs are variable - Wedgewood Candle Co. Container Candle Division Contribution Margin Income Statement Results for Quarter 3 $ 2,596,750 Revenues Variable Costs DM DL $ $ $ $ 630,700 202,300 431,375 925,000 $ 1,098,050 $ 1,498,700 $ 1,098,050 1,498,700 $ MOH Selling and Admin Total Variable Costs Contribution Margin Fixed Costs MOH Selling & Admin. Total Fixed Costs Division Operating Income $ $ 431,375 925,000 $ $ 1,091,325$ 407,375$ 1,091,325 407,375 Task 2) Based upon your contribution margin income statement above, compute the following answers. (You must display computations for full credit.) (Show your computations here) See Next page for all answers for task 2******* "WS2 TASK 2" Selling Price per Unit (Show your computations here) Variable Cost Per Unit Contribution Margin Per Unit (Show your computations here) Contribution Margin Ratio (percentage) (Show your computations here) Breakeven Point in Units (Show your computations here) Breakeven Point in Sales (using the contribution margin ratio method) (Show your computations here) Margin of Safety (in dollars) Task 3) Complete the following CVP analysis using quantity of units produced in 50,000 unit increments; beginning at 0 units and ending at 500,000 units Quantity Total Sales Total Variable Costs Total Fixed Costs Total Costs Net Income (Loss) 0 50,000 100,000 150,000 200,000 250,000 300,000 350,000 400,000 450,000 500,000 Task 4) Create a CVP breakeven chart (based upon quantity of units produced/sold and related dollar value from Task 3 above. The graph should depict the following: CA Total Revenue Line Total Cost Line Fixed Cost Line Area of Loss Area of Profit Breakeven Point Partial example