

Answered step by step
Verified Expert Solution
Question
1 Approved Answer
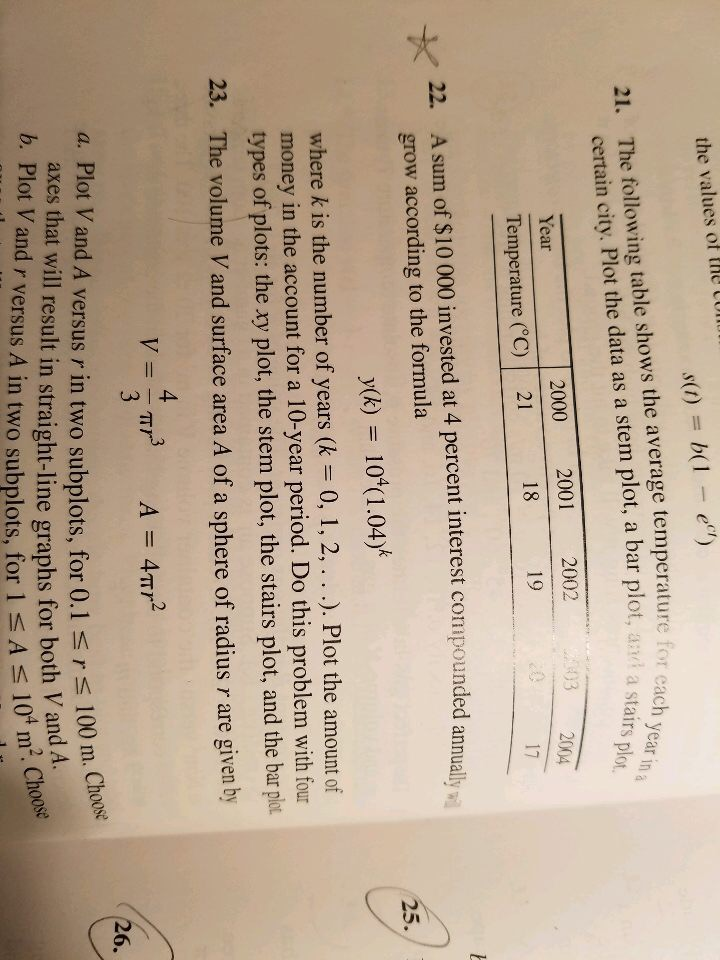
Introduction To Matlab For Engineers 3rd Edition Chapter 5 problem 22 the answer that I found in chegg is not correct. the values of tHe
Introduction To Matlab For Engineers 3rd Edition
Chapter 5 problem 22
the answer that I found in chegg is not correct.
Step by Step Solution
There are 3 Steps involved in it
Step: 1

Get Instant Access to Expert-Tailored Solutions
See step-by-step solutions with expert insights and AI powered tools for academic success
Step: 2

Step: 3
Ace Your Homework with AI
Get the answers you need in no time with our AI-driven, step-by-step assistance
Get Started
Data Management Databases And Organizations
Authors: Watson Watson
5th Edition
0471715360, 978-0471715368