Introduction to Statistic
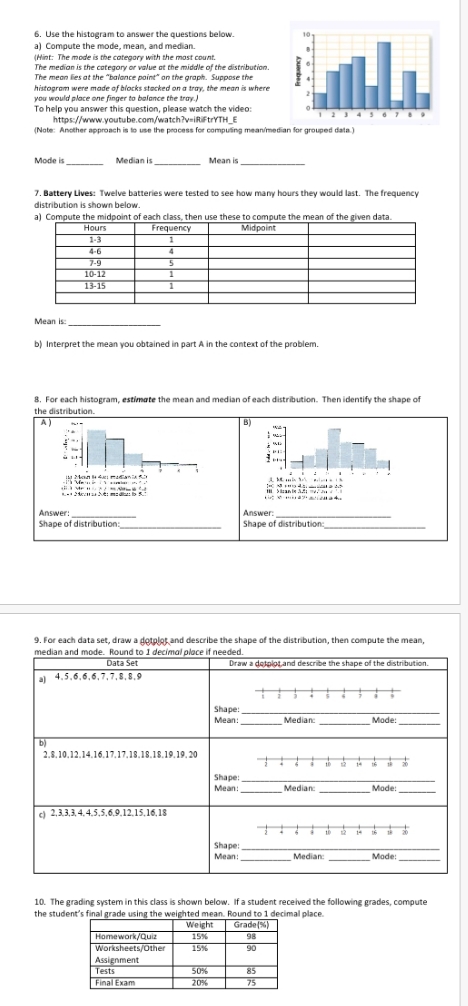
6. Use the histogram to answer the questions below. a) Compute the mode, mean, and median. (Hint: The mode is the cofegory with the most count. The median is the category or value of the middle of the distribution. The mean lies at the "balance point" on the groph. Suppose the histogram were made of blocks stacked on a troy, the mean is where you would place one finger to balance the troy./ To help you answer this question, please watch the video: http:://www.youtube.com/watch?v=iRiFtryTH_E (Note: Another approach is to use the process for computing meanimmedian for grouped data) Mode Is Median is Mean is 7. Battery Lives: Twelve batteries were tested to see how many hours they would last. The frequency distribution is shown below. a) Compute the midpoint of each class, then use these to compute the mean of the given data Hours Frequency Midpoint 1-3 4-6 4 7-9 5 10-12 I 13-1 Mean is: b) Interpret the mean you obtained in part A in the context of the problem. B. For each histogram, estimate the mean and median of each distribution. Then identify the shape of the distribution. B Answer! Answer: Shape of distribution: Shape of distributions 9. For each data set, draw a dotplot and describe the shape of the distribution, then compute the mean, median and mode. Round to 1 decimal place if needed. Data Set Draw a dotplot and describe the shape of the distribution. 21 4.5.6.6.6.7,7.8.8.9 Shape: Mean! Median Mode: 2.6. 10.12.14.16.17.17.18.18.18.19.19.20 Shape: Mean: Median _Mode: c) 2.3.3.3, 4. 4.5.5,6.9.12.15.16.18 Shape: Mean! Median: Mode: 10. The grading system in this class is shown below. If a student received the following grades, compute the student's final grade using the weighted mean. Round to 1 decimal place. Weight Grade(%%) Home work/Quiz 15% 98 Worksheets/Other 15%% 90 Assignment Tests 50% 85 Final Exam 75