Question
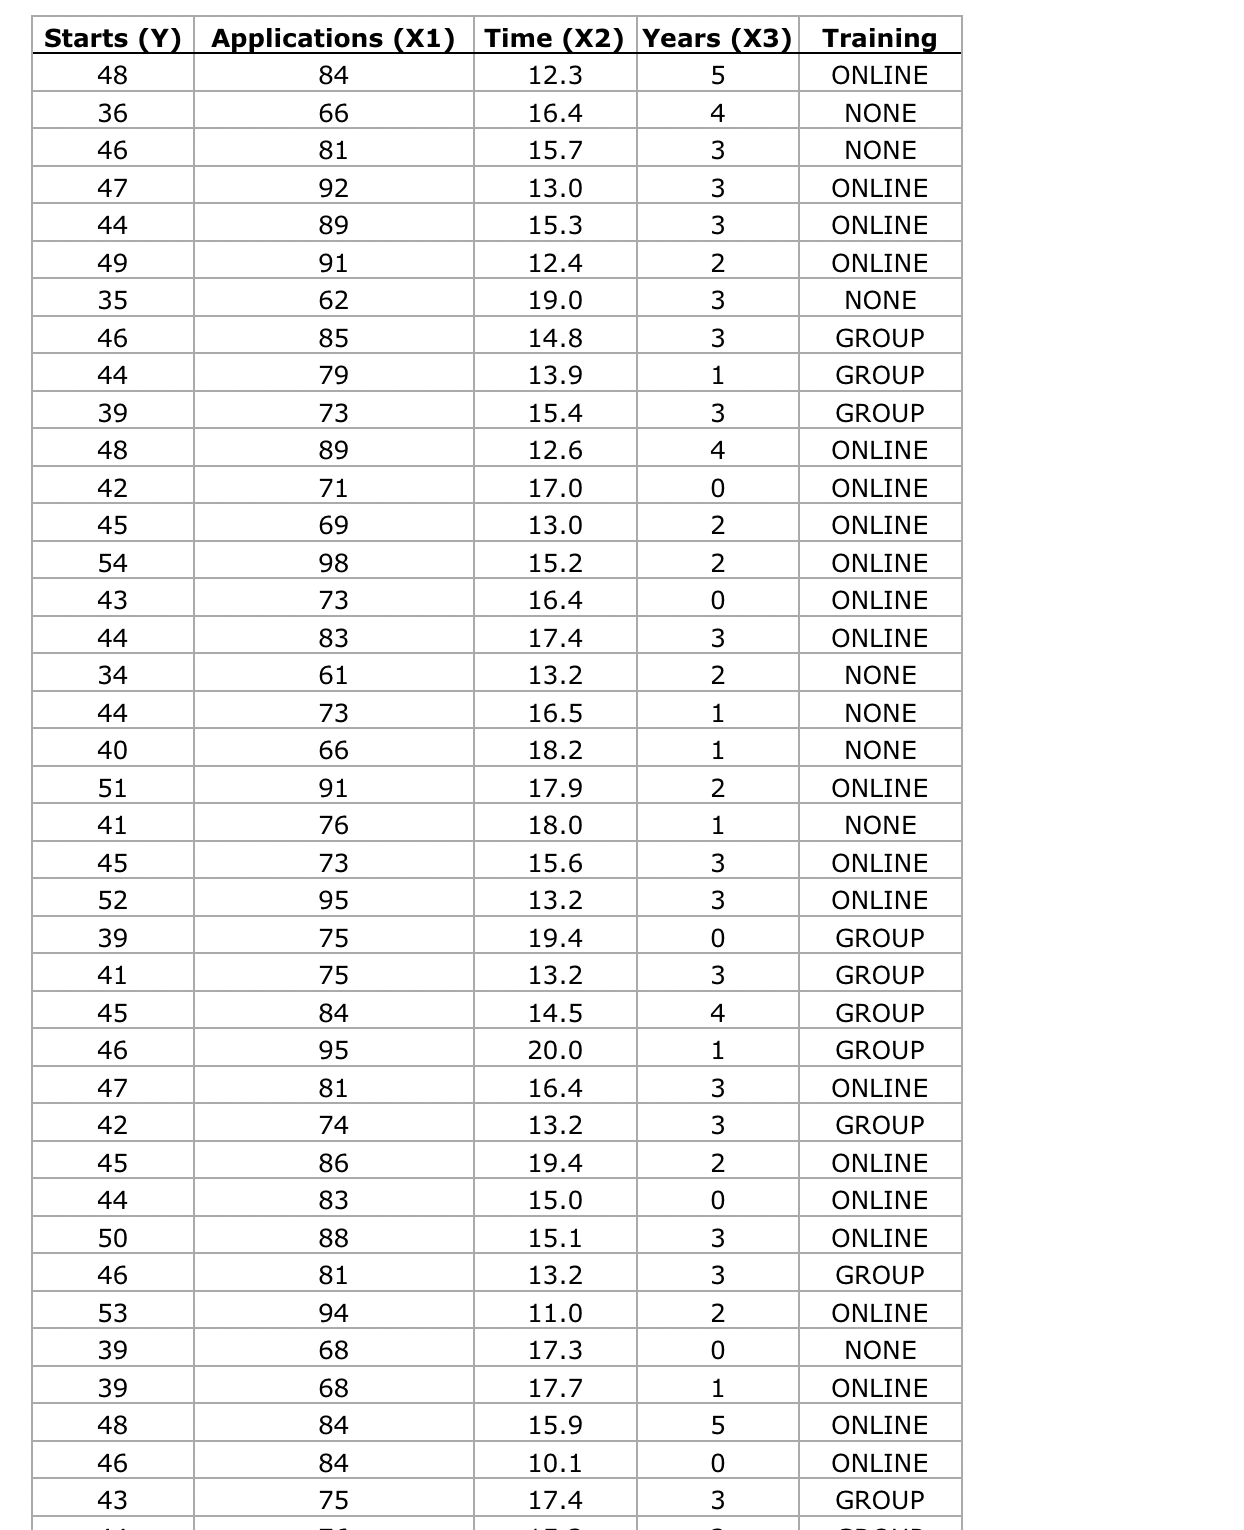
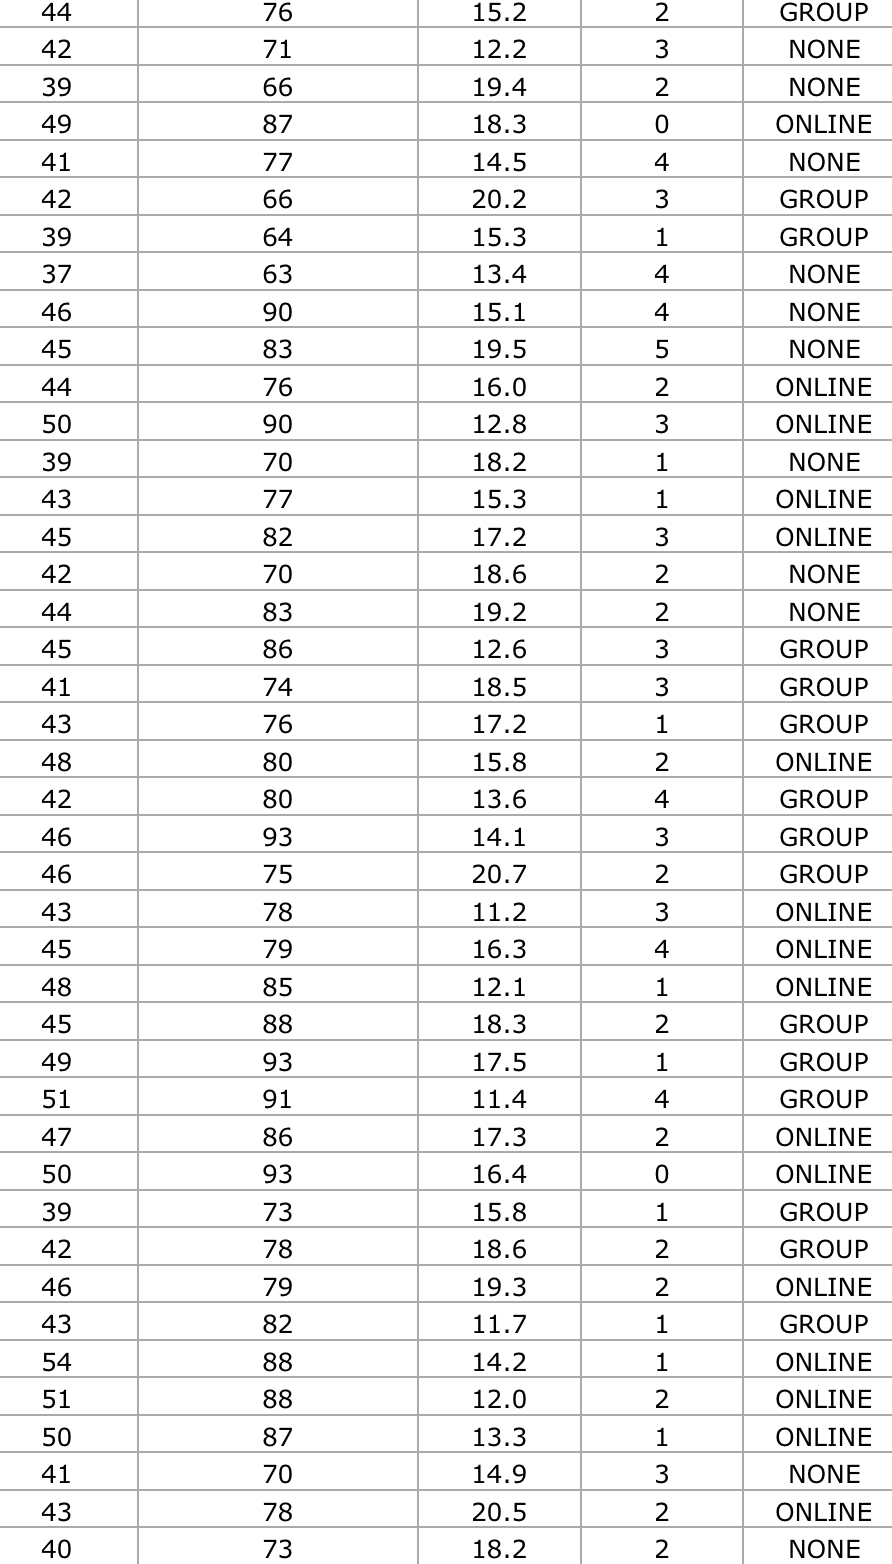
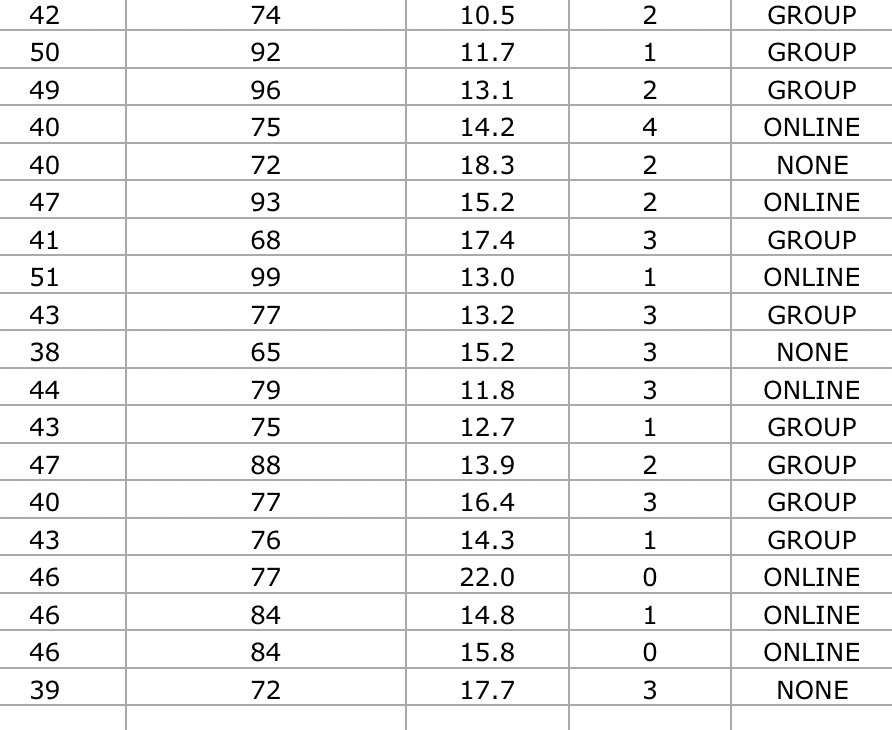
Introduction Your instructor will provide you with an Excel spreadsheet showing DeVry admissions data for the past semester, for 100 admissions advisors.Each row represents one
Introduction
Your instructor will provide you with an Excel spreadsheet showing DeVry admissions data for the past semester, for 100 admissions advisors.Each row represents one admissions advisor, and the includes data on five variables:
STARTSrepresents the number of students who started classes at DeVry.
APPLICATIONSrepresents the number of potential students who applied to DeVry.
TIMErepresents the average time spent with potential students during their first inquiry about DeVry.
YEARSrepresents years of experience as a DeVry admissions advisor.
TRAININGrepresents the type of training the admissions advisor received.
Part A: Exploratory Data AnalysisPreparation
- Open the files for the Course Project and the data set.
- For each of the five variables, process, organize, present, and summarize the data. Analyze each variable by itself using graphical and numerical techniques of summarization. Use Excel as much as possible, explaining what the results reveal. Some of the following graphs may be helpful: stem-leaf diagram, frequency/relative frequency table, histogram, boxplot, dotplot, pie chart, and bar graph. Caution: not all of these are appropriate for each of these variables, nor are they all necessary. More is not necessarily better. In addition, be sure to find the appropriate measures of central tendency, the measures of dispersion, and the shapes of the distributions (for the quantitative variables) for the above data. Where appropriate, use the five number summary (the Min, Q1, Median, Q3, Max). Once again, use Excel as appropriate, and explain what the results mean.
- Analyze the connections or relationships between the variables. There are 10 possible pairings of two variables. Use graphical as well as numerical summary measures. Explain the results of the analysis. Be sure to consider all 10 pairings. Some variables show clear relationships, whereas others do not.
Report Requirements
- From the variable analysis above, provide the analysis and interpretation forthree individual variables.This would include no more than one graph for each, one or two measures of central tendency and variability (as appropriate), the shapes of the distributions for quantitative variables, and two or three sentences of interpretation.
- For the 10 pairings, identify and report only onthree of the pairings, again using graphical and numerical summary (as appropriate), with interpretations.Please note that at least one pairing must include a qualitative variable, and at least one pairing must not include a qualitative variable.
- Prepare the report in Microsoft Word,integrating graphs and tables with text explanations and interpretations.Be sure to include graphical and numerical back up for the explanations and interpretations. Be selective in what is included in the report to meet the requirements of the report without extraneous information.
- Project Part A report is due by the end of Week 2.
- Project Part A is worth 100 total points. See the grading rubric below.
Submission: The report, including all relevant graphs and numerical analysis along with interpretationsFormat for report:
- Brief Introduction
- Discuss the first individual variable, using graphical, numerical summary and interpretation.
- Discuss the second individual variable, using graphical, numerical summary and interpretation.
- Discuss the third individual variable, using graphical, numerical summary and interpretation.
- Discuss the first pairing of variables, using graphical, numerical summary and interpretation.
- Discuss the second pairing of variables, using graphical, numerical summary and interpretation.
- Discuss the third pairing of variables, using graphical, numerical summary and interpretation.
- Conclusion
Submit your assignment.
Part A: Grading Rubric
CategoryPoints%DescriptionThree individual variables?12 points each3636Graphical analysis, numerical analysis (when appropriate), and interpretationThree relationships?15 points each4545Graphical analysis, numerical analysis (when appropriate), and interpretationCommunication skills1919Writing, grammar, clarity, logic, cohesiveness, adherence to the above formatTotal100100A quality paper will meet or exceed all of the above requirements.
Part B: Hypothesis Testing and Confidence Intervals
Complete the following four hypotheses, using ? = 0.05 for each.
- Mean starts this semester exceeds 41.5 per advisor
- Proportion receiving online training is less than 55%
- Mean applications taken among those with no training is less than 145
- Mean time per call is greater than 15 minutes
- Using the same data set from Part A, perform the hypothesis test for each speculation in order to see if there is evidence to support the manager's belief. Use the Seven Elements of a Test of Hypothesis from Section 7.1 of your textbook, as well as the p-value calculation from Section 7.3, and explain your conclusion in simple terms.
- Compute confidence intervals (the required confidence level is included with the speculations) for each of the variables described in A-D, and interpret these intervals.
- Make report about the results, distilling down the results in a way that would be understandable to someone who does not know statistics. Clear explanations and interpretations are critical.
- Project Part B report is due by the end of Week 6.
- Project Part B is worth 100 total points. See grading rubric below.
Format for report:
- Summary Report (about one paragraph on each of the speculations (a. - d.)
- Appendix with the calculations of the Seven Elements of a Test of Hypothesis, the p-values, and the confidence intervals?include the Excel formulas used in the calculations.
Submit your assignment.
Part B: Grading Rubric
CategoryPoints%DescriptionAddressing each speculation?20 points each8080Hypothesis test, interpretation, confidence interval, and interpretationSummary report clarity2020One paragraph on each of the speculationsTotal100100A quality paper will meet or exceed all of the above requirements.
Part C: Regression and Correlation Analysis
Use the dependent variable (labeled Y) and the independent variables (labeled X1, X2, and X3) in the data file. Use Excel to perform the regression and correlation analysis to answer the following.
- Generate a scatterplot for the specified dependent variable (Y) and the X1 independent variable, including the graph of the "best fit" line. Interpret.
- Determine the equation of the "best fit" line, which describes the relationship between the dependent variable and the selected independent variable.
- Determine the coefficient of correlation. Interpret.
- Determine the coefficient of determination. Interpret.
- Test the utility of this regression model. Interpret results, including the p-value.
- Based on the findings in Steps 1-5, analyze the ability of the independent variable to predict the designated dependent variable.
- Compute the confidence interval for ?1 (the population slope) using a 95% confidence level. Interpret this interval.
- Using an interval, estimate the average for the dependent variable for a selected value of the independent variable. Interpret this interval.
- Using an interval, predict the particular value of the dependent variable for a selected value of the independent variable. Interpret this interval.
- What can be said about the value of the dependent variable for values of the independent variable that are outside the range of the sample values? Explain.
- In an attempt to improve the model, use a multiple regression model to predict the dependent variable .Y, based on all of the independent variables. X1, X2, and X3.
- Using Excel, run the multiple regression analysis using the designated dependent and three independent variables. State the equation for this multiple regression model.
- Perform the Global Test for Utility (F-Test). Explain the conclusion.
- Perform the t-test on each independent variable. Explain the conclusions and clearly state how the analysis should proceed. In particular, which independent variables should be kept and which should be discarded. If any independent variables are to be discarded, re-run the multiple regression, including only the significant independent variables, and summarize results with discussion of analysis.
- Is this multiple regression model better than the linear model generated in parts 1-10? Explain.
- Part C report is due by the end of Week 7.
- Part C is worth 100 total points. See grading rubric below.
Summarize your results from Steps 1-14 in a three-page report. The report should explain and interpret the results in ways that are understandable to someone who does not know statistics.
Submission: The summary report and all of the work done in 1-14 (Excel output and interpretations) as an appendix
Submit your assignment.
Format for report:
- Summary Report
- Points 1-14 should be addressed with appropriate output, graphs, and interpretations. Be sure to number each point 1-18.
Part C: Grading Rubric
CategoryPoints%DescriptionSteps 1-12 and step 14 worth 5 points each6565Addressed with appropriate output, graphs, and interpretationsStep 131515Addressed with appropriate output, graphs, and interpretationsCommunication Skills2020Writing, grammar, clarity, logic, and cohesivenessTotal100100A quality paper will meet or exceed all of the above requirements.


Step by Step Solution
There are 3 Steps involved in it
Step: 1

Get Instant Access to Expert-Tailored Solutions
See step-by-step solutions with expert insights and AI powered tools for academic success
Step: 2

Step: 3

Ace Your Homework with AI
Get the answers you need in no time with our AI-driven, step-by-step assistance
Get Started


