Answered step by step
Verified Expert Solution
Link Copied!

Question

1 Approved Answer

A researcher studying correlates of obesity performed a linear regression analysis of the relationship between Body Mass Index (BMI) and Diastolic Blood Pressure (DBP). Part
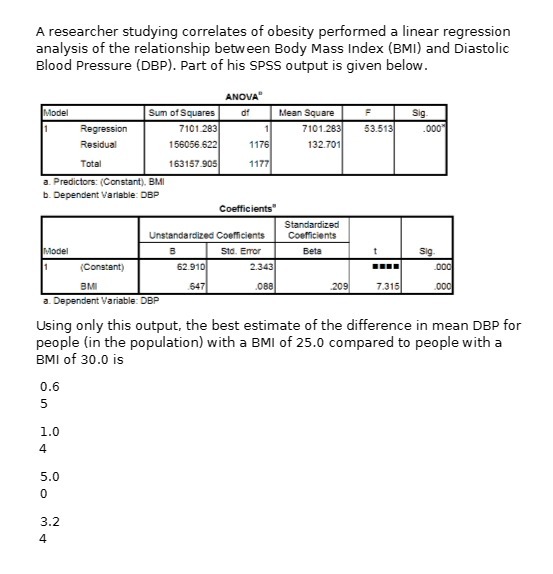
image text in transcribed
A researcher studying correlates of obesity performed a linear regression analysis of the relationship between Body Mass Index (BMI) and Diastolic Blood Pressure (DBP). Part of his SPSS output is given below. ANOVA" Model Sum of Squares Mean Square F Sig Regression 7101 283 7101.283 53.513 000 Residual 156056.622 1176 132.701 Total 163157-905 1177 a. Predictors: (Constant), BM . Dependent Variable: DBP Coefficients Standardized Unstandardized Coofficiants Conficients Model 51d. Error Bets Sig (Constant 62.910 2.343 DOC BM 547 209 7.318 a. Dependent Variable: DBP Using only this output, the best estimate of the difference in mean DBP for people (in the population) with a BMI of 25.0 compared to people with a BMI of 30.0 is 0.6 5 1.0 4 5.0 0 3.2 4

Step by Step Solution

There are 3 Steps involved in it

Step: 1

blur-text-image

Get Instant Access to Expert-Tailored Solutions

See step-by-step solutions with expert insights and AI powered tools for academic success

Step: 2

blur-text-image

Step: 3

blur-text-image

Ace Your Homework with AI

Get the answers you need in no time with our AI-driven, step-by-step assistance

Get Started

Recommended Textbook for

Linear Algebra with Applications

Authors: Steven J. Leon

7th edition

131857851, 978-0131857858

More Books

Students also viewed these Mathematics questions

Question

Deloitte (www.deloitte.com)

Answered: 1 week ago