Answered step by step
Verified Expert Solution
Question
1 Approved Answer
Inventory Turns COGS/Average Inventory (Or Year End Inventory) Gross Margin (Net Revenue COGS)/Net Revenue Current Ratio Current Assets/Current Liabilities Quick Ratio (Current Assets-Inventory)/Current Liabilities Liabilities
Inventory Turns COGS/Average Inventory (Or Year End Inventory)
Gross Margin (Net Revenue COGS)/Net Revenue
Current Ratio Current Assets/Current Liabilities
Quick Ratio (Current Assets-Inventory)/Current Liabilities
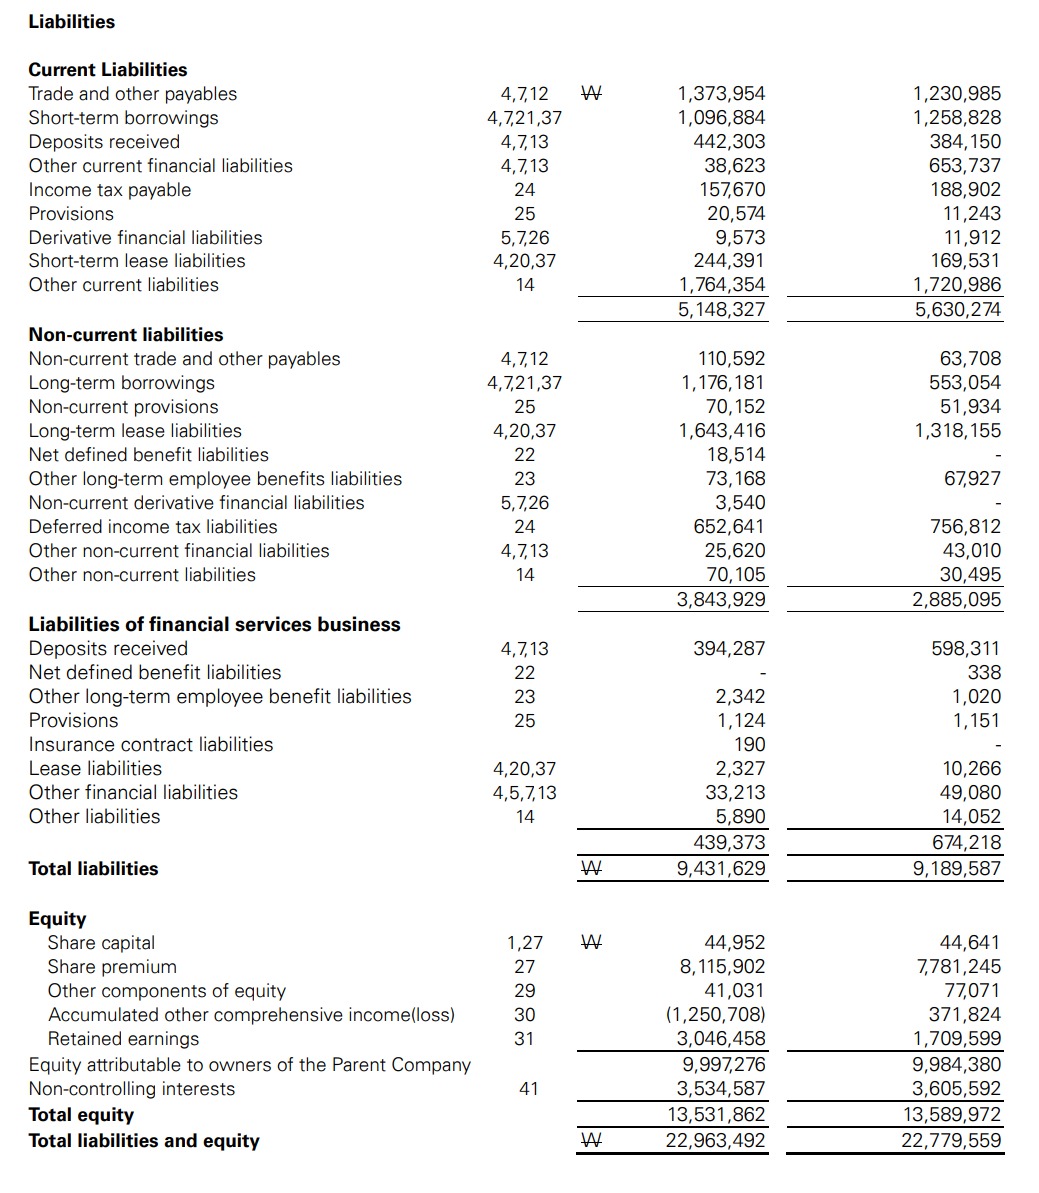
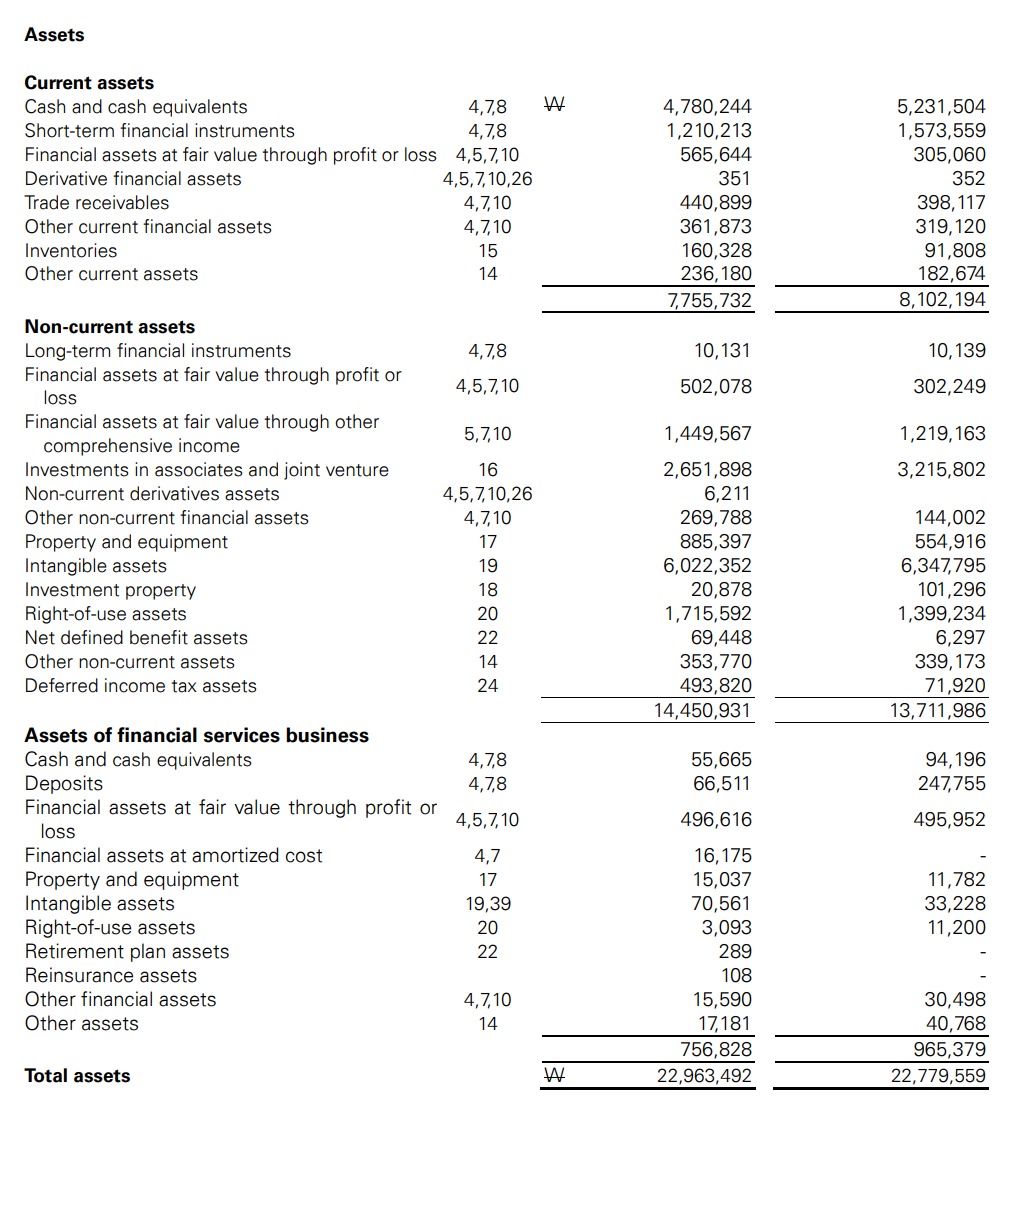
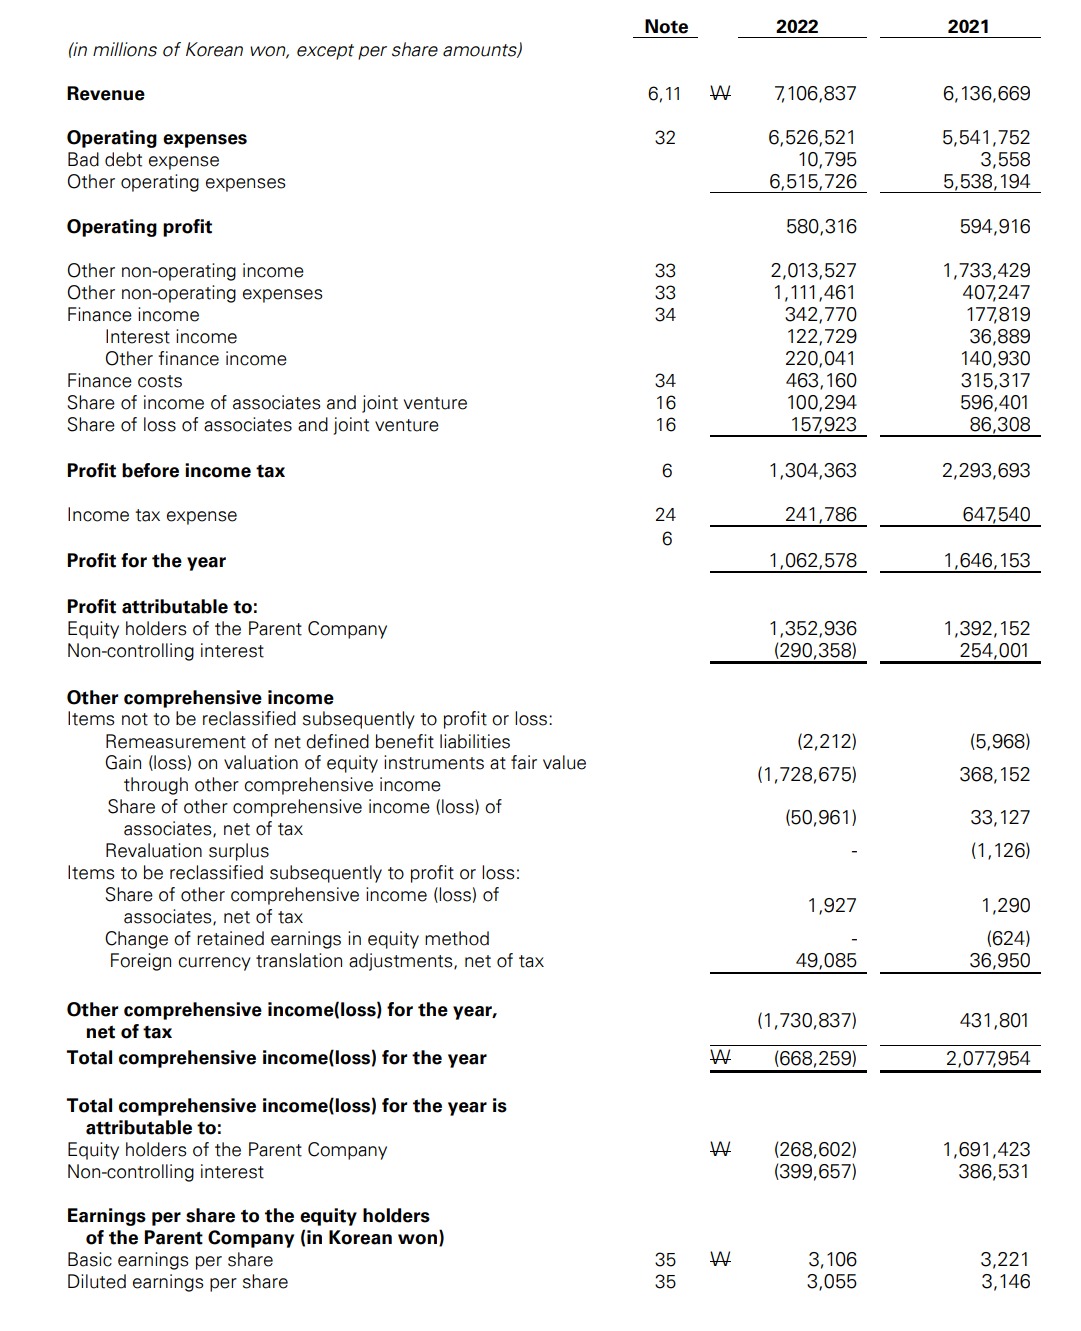
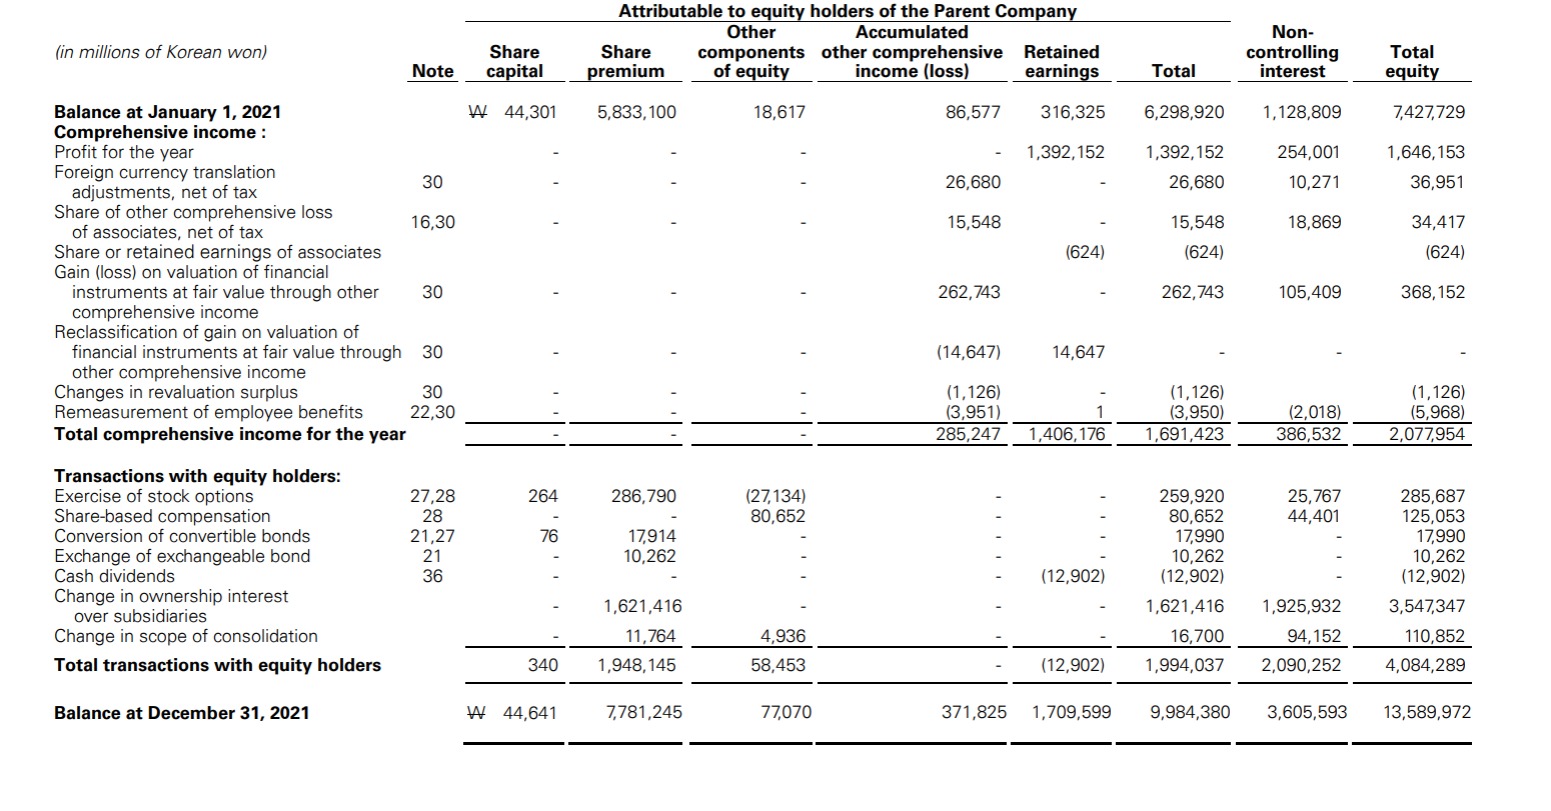
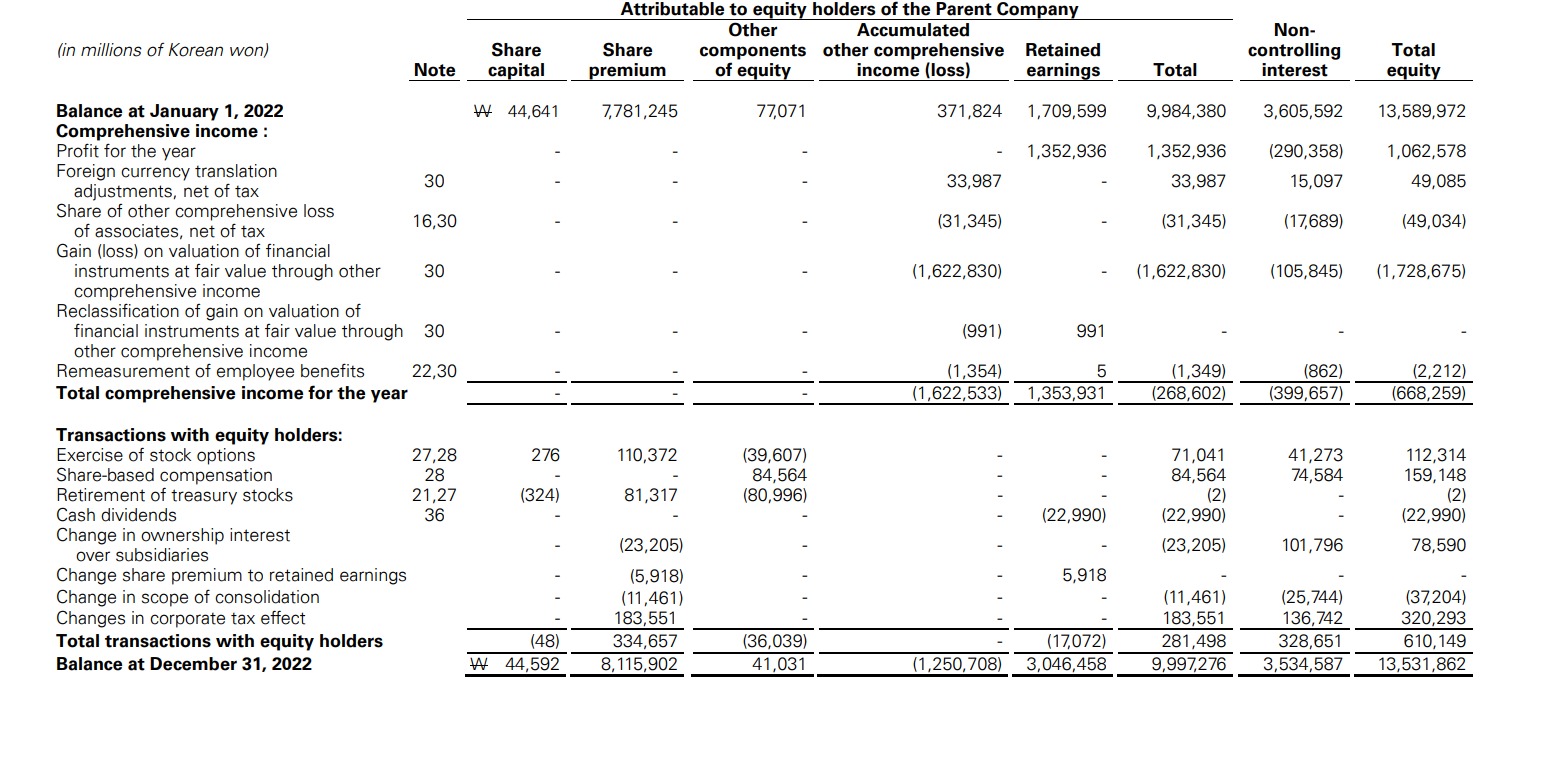
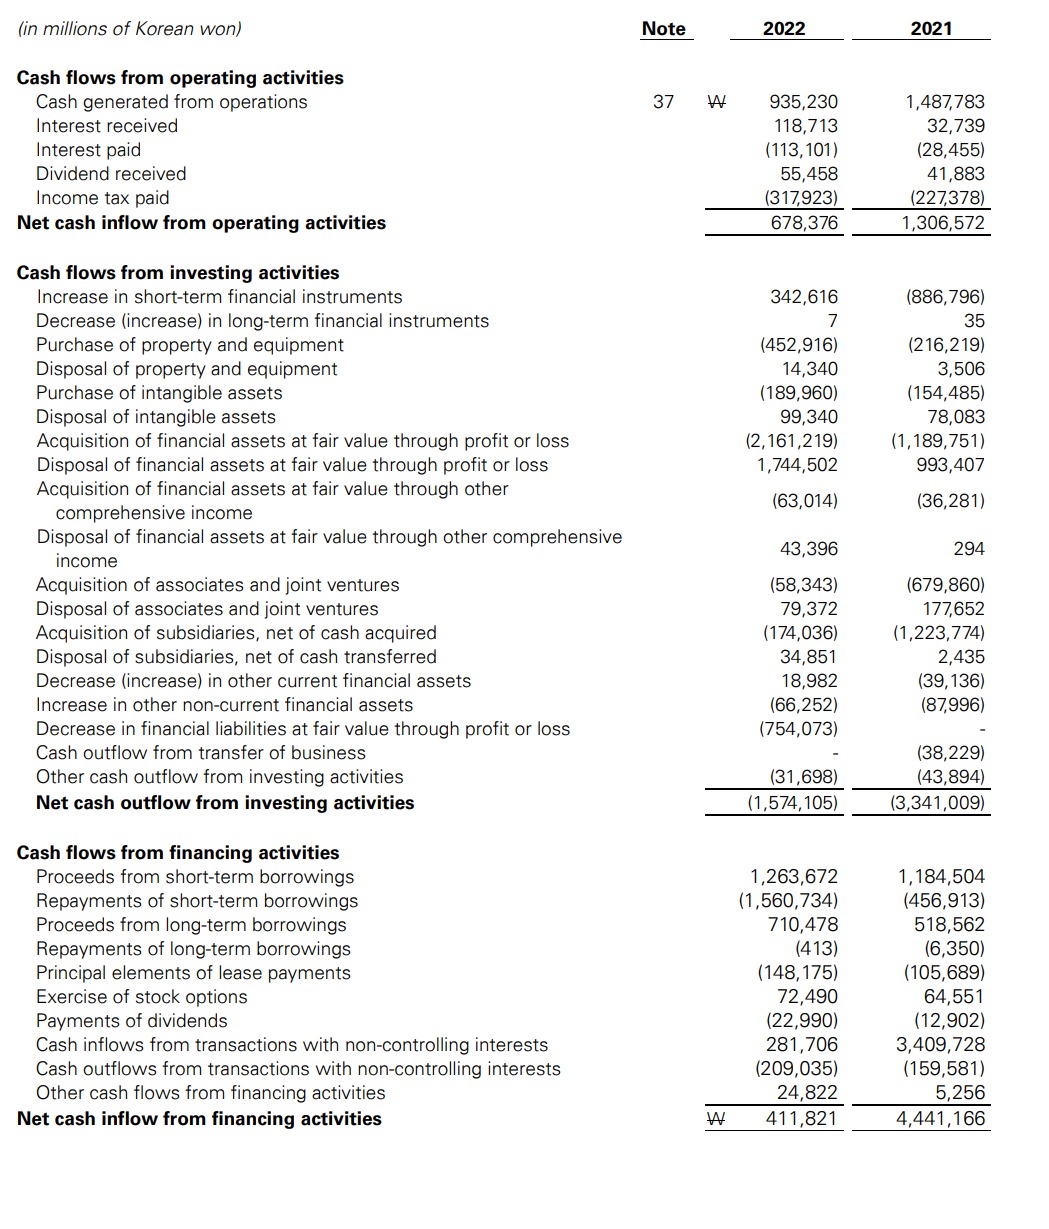
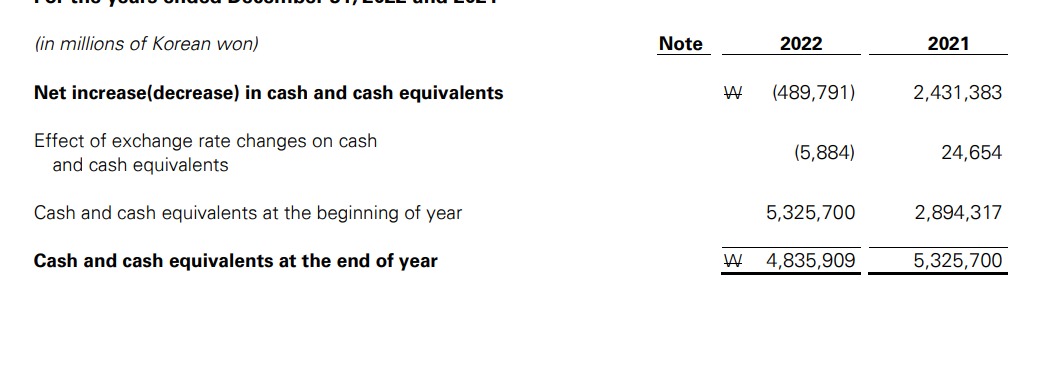
Liabilities \begin{tabular}{|c|c|c|c|} \hline \multicolumn{4}{|l|}{ Current Liabilities } \\ \hline Trade and other payables & 4,7,12 & 1,373,954 & 1,230,985 \\ \hline Short-term borrowings & 4,7,21,37 & 1,096,884 & 1,258,828 \\ \hline Deposits received & 4,7,13 & 442,303 & 384,150 \\ \hline Other current financial liabilities & 4,7,13 & 38,623 & 653,737 \\ \hline Income tax payable & 24 & 157,670 & 188,902 \\ \hline Provisions & 25 & 20,574 & 11,243 \\ \hline Derivative financial liabilities & 5,7,26 & 9,573 & 11,912 \\ \hline Short-term lease liabilities & 4,20,37 & 244,391 & 169,531 \\ \hline Other current liabilities & 14 & 1,764,354 & 1,720,986 \\ \hline & & 5,148,327 & 5,630,274 \\ \hline Non-current liabilities & & & \\ \hline Non-current trade and other payables & 4,7,12 & 110,592 & 63,708 \\ \hline Long-term borrowings & 4,7,21,37 & 1,176,181 & 553,054 \\ \hline Non-current provisions & 25 & 70,152 & 51,934 \\ \hline Long-term lease liabilities & 4,20,37 & 1,643,416 & 1,318,155 \\ \hline Net defined benefit liabilities & 22 & 18,514 & \\ \hline Other long-term employee benefits liabilities & 23 & 73,168 & 67,927 \\ \hline Non-current derivative financial liabilities & 5,7,26 & 3,540 & - \\ \hline Deferred income tax liabilities & 24 & 652,641 & 756,812 \\ \hline Other non-current financial liabilities & 4,7,13 & 25,620 & 43,010 \\ \hline Other non-current liabilities & 14 & 70,105 & 30,495 \\ \hline & & 3,843,929 & 2,885,095 \\ \hline Liabilities of financial services business & & & \\ \hline Deposits received & 4,7,13 & 394,287 & 598,311 \\ \hline Net defined benefit liabilities & 22 & - & 338 \\ \hline Other long-term employee benefit liabilities & 23 & 2,342 & 1,020 \\ \hline Provisions & 25 & 1,124 & 1,151 \\ \hline Insurance contract liabilities & & 190 & \\ \hline Lease liabilities & 4,20,37 & 2,327 & 10,266 \\ \hline Other financial liabilities & 4,5,7,13 & 33,213 & 49,080 \\ \hline Other liabilities & 14 & 5,890 & 14,052 \\ \hline & & 439,373 & 674,218 \\ \hline Total liabilities & & 9,431,629 & 9,189,587 \\ \hline Equity & & & \\ \hline Share capital & 1,27 & 44,952 & 44,641 \\ \hline Share premium & 27 & 8,115,902 & 7,781,245 \\ \hline Other components of equity & 29 & 41,031 & 77,071 \\ \hline Accumulated other comprehensive income(loss) & 30 & (1,250,708) & 371,824 \\ \hline Retained earnings & 31 & 3,046,458 & 1,709,599 \\ \hline Equity attributable to owners of the Parent Company & & 9,997,276 & 9,984,380 \\ \hline Non-controlling interests & 41 & 3,534,587 & 3,605,592 \\ \hline Total equity & & 13,531,862 & 13,589,972 \\ \hline Total liabilities and equity & & 22,963,492 & 22,779,559 \\ \hline \end{tabular} Assets \begin{tabular}{|c|c|c|c|} \hline \multicolumn{4}{|l|}{ Current assets } \\ \hline Cash and cash equivalents & 4,7,8 & 4,780,244 & 5,231,504 \\ \hline Short-term financial instruments & 4,7,8 & 1,210,213 & 1,573,559 \\ \hline Financial assets at fair value through profit or loss & 4,5,7,10 & 565,644 & 305,060 \\ \hline Derivative financial assets & 4,5,7,10,26 & 351 & 352 \\ \hline Trade receivables & 4,7,10 & 440,899 & 398,117 \\ \hline Other current financial assets & 4,7,10 & 361,873 & 319,120 \\ \hline Inventories & 15 & 160,328 & 91,808 \\ \hline \multirow[t]{2}{*}{ Other current assets } & 14 & 236,180 & 182,674 \\ \hline & & 7,755,732 & 8,102,194 \\ \hline \multicolumn{4}{|l|}{ Non-current assets } \\ \hline Long-term financial instruments & 4,7,8 & 10,131 & 10,139 \\ \hline \begin{tabular}{l} Financial assets at fair value through profit or \\ loss \end{tabular} & 4,5,7,10 & 502,078 & 302,249 \\ \hline \begin{tabular}{l} Financial assets at fair value through other \\ comprehensive income \end{tabular} & 5,7,10 & 1,449,567 & 1,219,163 \\ \hline Investments in associates and joint venture & 16 & 2,651,898 & 3,215,802 \\ \hline Non-current derivatives assets & 4,5,7,10,26 & 6,211 & \\ \hline Other non-current financial assets & 4,7,10 & 269,788 & 144,002 \\ \hline Property and equipment & 17 & 885,397 & 554,916 \\ \hline Intangible assets & 19 & 6,022,352 & 6,347,795 \\ \hline Investment property & 18 & 20,878 & 101,296 \\ \hline Right-of-use assets & 20 & 1,715,592 & 1,399,234 \\ \hline Net defined benefit assets & 22 & 69,448 & 6,297 \\ \hline Other non-current assets & 14 & 353,770 & 339,173 \\ \hline \multirow[t]{2}{*}{ Deferred income tax assets } & 24 & 493,820 & 71,920 \\ \hline & & 14,450,931 & 13,711,986 \\ \hline \multicolumn{4}{|l|}{ Assets of financial services business } \\ \hline Cash and cash equivalents & 4,7,8 & 55,665 & 94,196 \\ \hline Deposits & 4,7,8 & 66,511 & 247,755 \\ \hline \begin{tabular}{l} Financial assets at fair value through profit or \\ loss \end{tabular} & 4,5,7,10 & 496,616 & 495,952 \\ \hline Financial assets at amortized cost & 4,7 & 16,175 & - \\ \hline Property and equipment & 17 & 15,037 & 11,782 \\ \hline Intangible assets & 19,39 & 70,561 & 33,228 \\ \hline Right-of-use assets & 20 & 3,093 & 11,200 \\ \hline Retirement plan assets & 22 & 289 & - \\ \hline Reinsurance assets & & 108 & \\ \hline Other financial assets & 4,7,10 & 15,590 & 30,498 \\ \hline \multirow[t]{2}{*}{ Other assets } & 14 & 17,181 & 40,768 \\ \hline & & 756,828 & 965,379 \\ \hline Total assets & & 22,963,492 & 22,779,559 \\ \hline \end{tabular} (in millions of Korean won) Net increase(decrease) in cash and cash equivalents Effect of exchange rate changes on cash and cash equivalents Cash and cash equivalents at the beginning of year Cash and cash equivalents at the end of year \begin{tabular}{|c|c|c|c|} \hline Note & & 2022 & 2021 \\ \hline & W & (489,791) & 2,431,383 \\ \hline & & (5,884) & 24,654 \\ \hline & & 5,325,700 & 2,894,317 \\ \hline & W & 4,835,909 & 5,325,700 \\ \hline \end{tabular} Attributable to equity holders of the Parent Company (in millions of Korean won) Balance at January 1, 2022 Comprehensive income : Profit for the year Foreign currency translation adjustments, net of tax Share of other comprehensive loss of associates, net of tax Gain (loss) on valuation of financial instruments at fair value through other comprehensive income Reclassification of gain on valuation of financial instruments at fair value through 30 other comprehensive income Remeasurement of employee benefits 22,30 Total comprehensive income for the year Transactions with equity holders: Exercise of stock options Share-based compensation Retirement of treasury stocks Cash dividends Change in ownership interest over subsidiaries Change share premium to retained earnings Change in scope of consolidation Changes in corporate tax effect Total transactions with equity holders Balance at December 31, 2022 (991) 991 (1,622,533)(1,354)1,353,9315(268,602)(1,349)(399,657)(862)(668,259)(2,212) Attributable to equity holders of the Parent Company (in millions of Korean won) Balance at January 1, 2021 Comprehensive income : Profit for the year Foreign currency translation adjustments, net of tax Share of other comprehensive loss of associates, net of tax Share or retained earnings of associates Gain (loss) on valuation of financial instruments at fair value through other comprehensive income Reclassification of gain on valuation of financial instruments at fair value through other comprehensive income Changes in revaluation surplus Remeasurement of employee benefits Total comprehensive income for the year Transactions with equity holders: Exercise of stock options Share-based compensation Conversion of convertible bonds Exchange of exchangeable bond Cash dividends Change in ownership interest over subsidiaries Change in scope of consolidation Total transactions with equity holders Balance at December 31, 2021 \begin{tabular}{|c|c|c|c|c|c|c|c|c|c|} \hline \multirow[b]{2}{*}{ Note } & \multicolumn{7}{|c|}{\begin{tabular}{c} Attributable to equity holders of the Parent Company \\ Other Accumulated \end{tabular}} & \multirow[b]{2}{*}{\begin{tabular}{c} Non- \\ controlling \\ interest \end{tabular}} & \multirow[b]{2}{*}{\begin{tabular}{c} Total \\ equity \end{tabular}} \\ \hline & & \begin{tabular}{l} Share \\ :apital \end{tabular} & \begin{tabular}{c} Share \\ premium \end{tabular} & \begin{tabular}{c} \begin{tabular}{c} Other \\ components \\ of equity \end{tabular} \\ \end{tabular} & \begin{tabular}{c} Accumulated \\ other comprehensive \\ income (loss) \\ \end{tabular} & \begin{tabular}{l} Retained \\ earnings \end{tabular} & Total & & \\ \hline & W & 44,301 & 5,833,100 & 18,617 & 86,577 & 316,325 & 6,298,920 & 1,128,809 & 7,427,729 \\ \hline & & - & - & - & - & 1,392,152 & 1,392,152 & 254,001 & 1,646,153 \\ \hline 30 & & - & - & - & 26,680 & - & 26,680 & 10,271 & 36,951 \\ \hline 16,30 & & - & - & - & 15,548 & - & 15,548 & 18,869 & 34,417 \\ \hline & & & & & & (624) & (624) & & (624) \\ \hline 30 & & - & - & - & 262,743 & - & 262,743 & 105,409 & 368,152 \\ \hline 30 & & - & - & - & (14,647) & 14,647 & - & - & - \\ \hline 30 & & - & - & - & (1,126) & - & (1,126) & & (1,126) \\ \hline 22,30 & & - & = & - & (3,951) & 1 & (3,950) & (2,018) & (5,968) \\ \hline & & & & - & 285,247 & 1,406,176 & 1,691,423 & 386,532 & 2,077,954 \\ \hline 27,28 & & 264 & 286,790 & (27,134) & - & - & 259,920 & 25,767 & 285,687 \\ \hline 28 & & & & 80,652 & - & - & 80,652 & 44,401 & 125,053 \\ \hline 21,27 & & 76 & 17,914 & - & - & - & 17,990 & - & 17,990 \\ \hline 21 & & - & 10,262 & - & - & - & 10,262 & - & 10,262 \\ \hline 36 & & - & - & - & - & (12,902) & (12,902) & - & (12,902) \\ \hline & & - & 1,621,416 & - & - & - & 1,621,416 & 1,925,932 & 3,547,347 \\ \hline & & - & 11,764 & 4,936 & - & - & 16,700 & 94,152 & 110,852 \\ \hline & & 340 & 1,948,145 & 58,453 & - & (12,902) & 1,994,037 & 2,090,252 & 4,084,289 \\ \hline & W & 44,641 & 7,781,245 & 77,070 & 371,825 & 1,709,599 & 9,984,380 & 3,605,593 & 13,589,972 \\ \hline \end{tabular} \begin{tabular}{|c|c|c|c|c|} \hline (in millions of Korean won, except per share amounts) & \multicolumn{2}{|l|}{ Note } & 2022 & 2021 \\ \hline Revenue & 6,11 & W & 7,106,837 & 6,136,669 \\ \hline \begin{tabular}{l} Operating expenses \\ Bad debt expense \\ Other operating expenses \end{tabular} & 32 & & \begin{tabular}{r} 6,526,521 \\ 10,795 \\ 6,515,726 \\ \end{tabular} & \begin{tabular}{r} 5,541,752 \\ 3,558 \\ 5,538,194 \\ \end{tabular} \\ \hline Operating profit & & & 580,316 & 594,916 \\ \hline \begin{tabular}{l} Other non-operating income \\ Other non-operating expenses \\ Finance income \\ Interest income \\ Other finance income \\ Finance costs \\ Share of income of associates and joint venture \\ Share of loss of associates and joint venture \end{tabular} & \begin{tabular}{l} 34 \\ 16 \\ 16 \end{tabular} & & \begin{tabular}{r} 2,013,527 \\ 1,111,461 \\ 342,770 \\ 122,729 \\ 220,041 \\ 463,160 \\ 100,294 \\ 157,923 \\ \end{tabular} & \begin{tabular}{r} 1,733,429 \\ 407,247 \\ 177,819 \\ 36,889 \\ 140,930 \\ 315,317 \\ 596,401 \\ 86,308 \\ \end{tabular} \\ \hline Profit before income tax & 6 & & 1,304,363 & 2,293,693 \\ \hline Income tax expense & 24 & & 241,786 & 647,540 \\ \hline Profit for the year & 6 & & 1,062,578 & 1,646,153 \\ \hline \begin{tabular}{l} Profit attributable to: \\ Equity holders of the Parent Company \\ Non-controlling interest \end{tabular} & & & \begin{tabular}{r} 1,352,936 \\ (290,358) \\ \end{tabular} & \begin{tabular}{r} 1,392,152 \\ 254,001 \\ \end{tabular} \\ \hline \begin{tabular}{l} Other comprehensive income \\ Items not to be reclassified subsequently to profit or loss: \end{tabular} & & & & \\ \hline \begin{tabular}{l} Gain (loss) on valuation of equity instruments at fair value \\ through other comprehensive income \end{tabular} & & & \begin{tabular}{r} (2,212) \\ (1,728,675) \end{tabular} & \begin{tabular}{r} (5,968) \\ 368,152 \end{tabular} \\ \hline \begin{tabular}{l} Share of other comprehensive income (loss) of \\ associates, net of tax \end{tabular} & & & (50,961) & 33,127 \\ \hline \begin{tabular}{l} Revaluation surplus \\ Items to be reclassified subsequently to profit or loss: \end{tabular} & & & - & (1,126) \\ \hline \begin{tabular}{l} Share of other comprehensive income (loss) of \\ associates, net of tax \end{tabular} & & & 1,927 & 1,290 \\ \hline \begin{tabular}{l} Change of retained earnings in equity method \\ Foreign currency translation adjustments, net of tax \end{tabular} & & & 49,085 & \begin{tabular}{r} (624) \\ 36,950 \\ \end{tabular} \\ \hline \begin{tabular}{l} Other comprehensive income(loss) for the year, \\ net of tax \end{tabular} & & & (1,730,837) & 431,801 \\ \hline Total comprehensive income(loss) for the year & & W & (668,259) & 2,077,954 \\ \hline \begin{tabular}{l} Total comprehensive income(loss) for the year is \\ attributable to: \\ Equity holders of the Parent Company \\ Non-controlling interest \end{tabular} & & W & \begin{tabular}{l} (268,602) \\ (399,657) \end{tabular} & \begin{tabular}{r} 1,691,423 \\ 386,531 \end{tabular} \\ \hline \begin{tabular}{l} Earnings per share to the equity holders \\ of the Parent Company (in Korean won) \end{tabular} & & & & \\ \hline \begin{tabular}{l} Basic earnings per share \\ Diluted earnings per share \end{tabular} & \begin{tabular}{l} 35 \\ 35 \end{tabular} & W & \begin{tabular}{l} 3,106 \\ 3,055 \end{tabular} & \begin{tabular}{l} 3,221 \\ 3,146 \end{tabular} \\ \hline \end{tabular} (in millions of Korean won) Note 2022 2021 Cash flows from operating activities Cash generated from operations Interest received Interest paid Dividend received Income tax paid Net cash inflow from operating activities Cash flows from investing activities Increase in short-term financial instruments Decrease (increase) in long-term financial instruments Purchase of property and equipment Disposal of property and equipment Purchase of intangible assets Disposal of intangible assets Acquisition of financial assets at fair value through profit or loss Disposal of financial assets at fair value through profit or loss Acquisition of financial assets at fair value through other comprehensive income Disposal of financial assets at fair value through other comprehensive income Acquisition of associates and joint ventures Disposal of associates and joint ventures Acquisition of subsidiaries, net of cash acquired Disposal of subsidiaries, net of cash transferred Decrease (increase) in other current financial assets Increase in other non-current financial assets Decrease in financial liabilities at fair value through profit or loss Cash outflow from transfer of business Other cash outflow from investing activities Net cash outflow from investing activities Cash flows from financing activities Proceeds from short-term borrowings Repayments of short-term borrowings Proceeds from long-term borrowings Repayments of long-term borrowings Principal elements of lease payments Exercise of stock options Payments of dividends Cash inflows from transactions with non-controlling interests Cash outflows from transactions with non-controlling interests Other cash flows from financing activities Net cash inflow from financing activities \begin{tabular}{rr} 37935,230 & 1,487,783 \\ 118,713 & 32,739 \\ (113,101) & (28,455) \\ 55,458 & 41,883 \\ (317,923) \\ \hline 678,376 \\ \hline \end{tabular} \begin{tabular}{rr} 342,616 & (886,796) \\ 7 & 35 \\ (452,916) & (216,219) \\ 14,340 & 3,506 \\ (189,960) & (154,485) \\ 99,340 & 78,083 \\ (2,161,219) & (1,189,751) \\ 1,744,502 & 993,407 \\ (63,014) & (36,281) \\ & \\ 43,396 & 294 \\ (58,343) & (679,860) \\ 79,372 & 177,652 \\ (174,036) & (1,223,774) \\ 34,851 & 2,435 \\ 18,982 & (39,136) \\ (66,252) & (87,996) \\ (754,073) & - \\ - & (38,229) \\ (31,698) & (43,894) \\ \hline(1,574,105) & (3,341,009) \\ \hline \end{tabular} \begin{tabular}{rr} 1,263,672 & 1,184,504 \\ (1,560,734) & (456,913) \\ 710,478 & 518,562 \\ (413) & (6,350) \\ (148,175) & (105,689) \\ 72,490 & 64,551 \\ (22,990) & (12,902) \\ 281,706 & 3,409,728 \\ (209,035) & (159,581) \\ 24,822 & 5,256 \\ \hline 4 & 411,821 \\ \hline \end{tabular}Step by Step Solution
There are 3 Steps involved in it
Step: 1

Get Instant Access to Expert-Tailored Solutions
See step-by-step solutions with expert insights and AI powered tools for academic success
Step: 2

Step: 3

Ace Your Homework with AI
Get the answers you need in no time with our AI-driven, step-by-step assistance
Get Started


