Answered step by step
Verified Expert Solution
Link Copied!

Question

1 Approved Answer

Is A the correct answer? 6. The 2010 National Hospital Ambulatory Medical Care Survey (NHAMCS) is a national (United States) sample survey of visits to

Is A the correct answer?
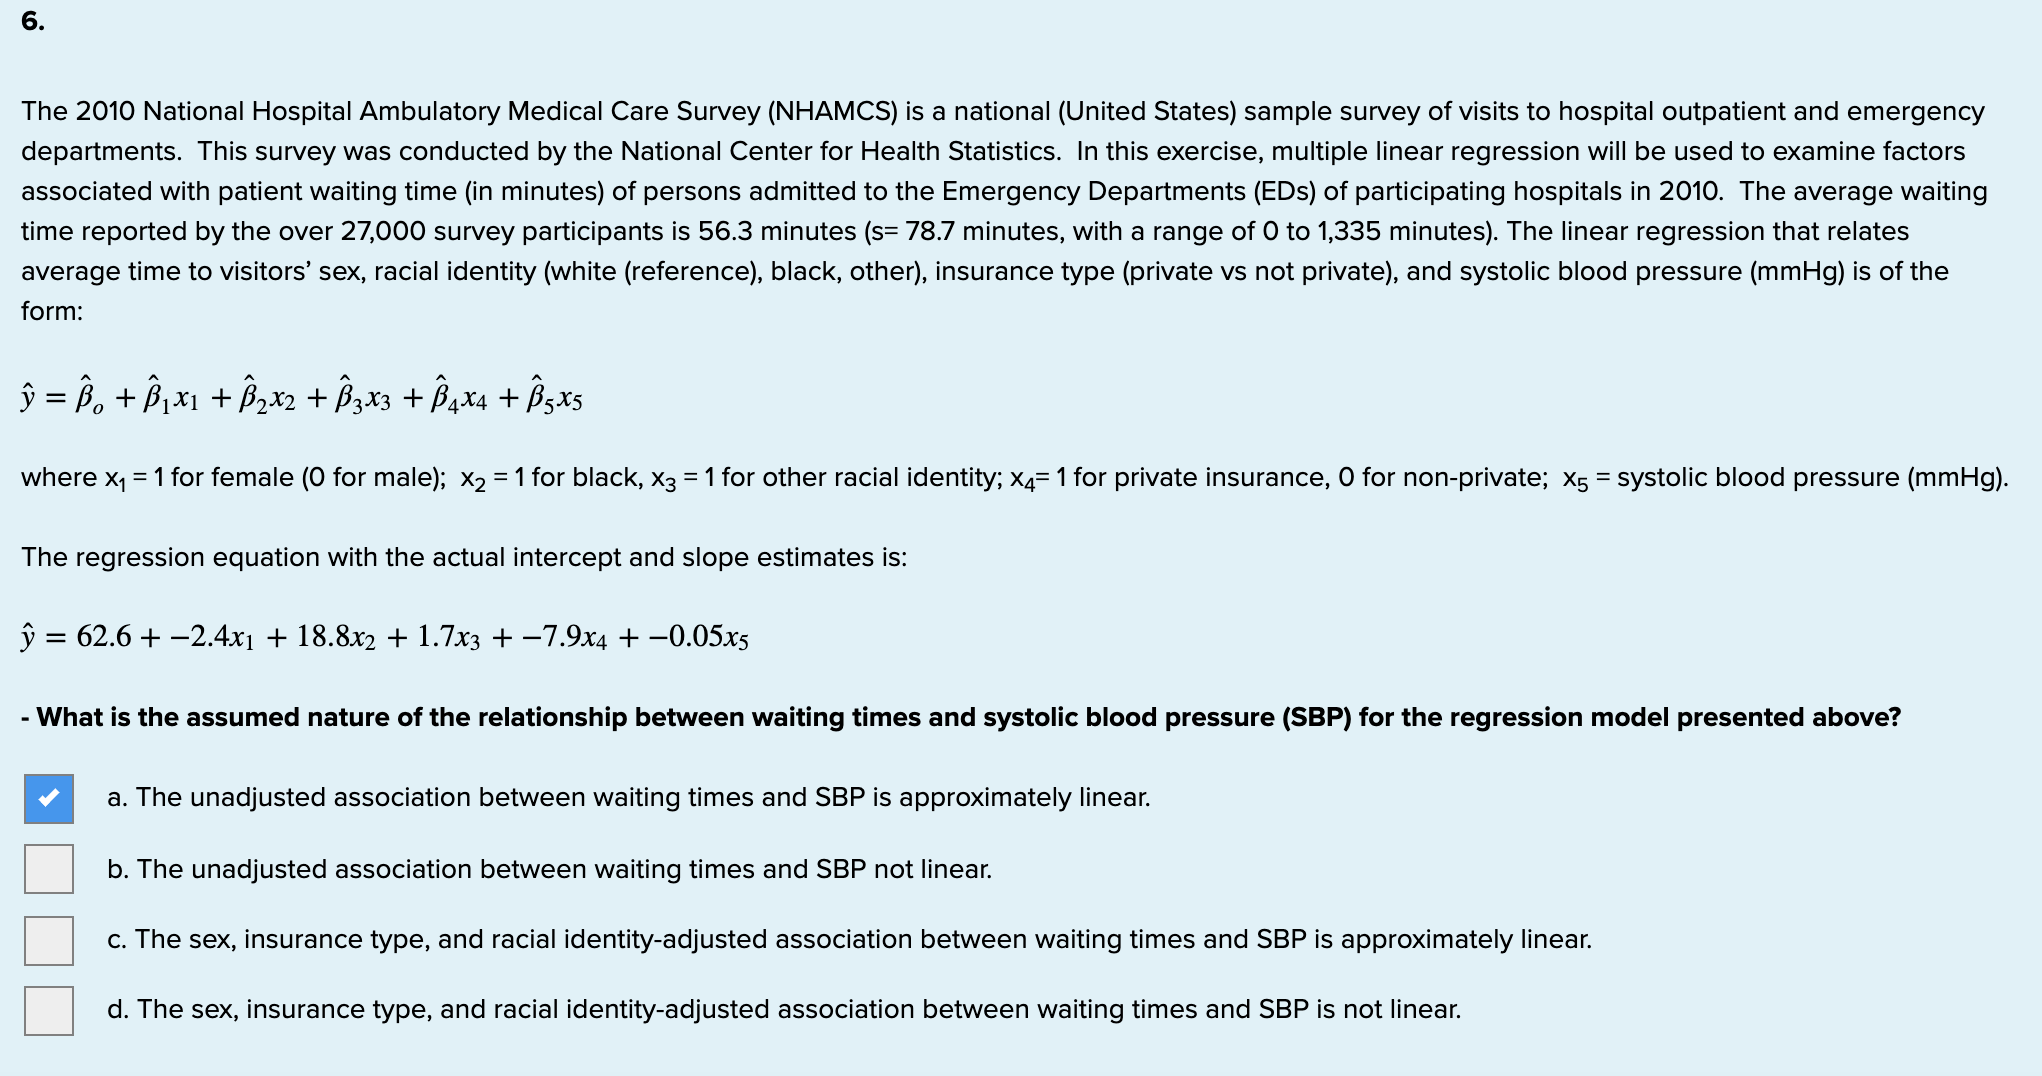
image text in transcribed
6. The 2010 National Hospital Ambulatory Medical Care Survey (NHAMCS) is a national (United States) sample survey of visits to hospital outpatient and emergency departments. This survey was conducted by the National Center for Health Statistics. In this exercise, multiple linear regression will be used to examine factors associated with patient waiting time (in minutes) of persons admitted to the Emergency Departments (EDS) of participating hospitals in 2010. The average waiting time reported by the over 27,000 survey participants is 56.3 minutes (s= 78.7 minutes, with a range of 0 to 1,335 minutes). The linear regression that relates average time to visitors' sex, racial identity (white (reference), black, other), insurance type (private vs not private), and systolic blood pressure (mmHg) is of the form: 9 = ii, + 31x1 + 32x2 + 33x3 + 3m + iisxs where x1=1 for female (0 for male); x; =1 for black, x3 = 1 for other racial identity; x4=1 for private insurance, 0 for nonprivate; x5 = systolic blood pressure (mmHg). The regression equation with the actual intercept and slope estimates is: SI = 62.6 + 2.4x1 + 18.8x2 + 1.7x3 + 7.9x4 + 0.05x5 - What is the assumed nature of the relationship between waiting times and watolic blood pressure (SBP) for the regression model presented above? a. The unadjusted association between waiting times and SBP is approximately linear. b. The unadjusted association between waiting times and SBP not linear. c. The sex, insurance type, and racial identityadjusted association between waiting times and SBP is approximately linear. d. The sex, insurance type, and racial identityadjusted association between waiting times and SBP is not linear

Step by Step Solution

There are 3 Steps involved in it

Step: 1

blur-text-image

Get Instant Access to Expert-Tailored Solutions

See step-by-step solutions with expert insights and AI powered tools for academic success

Step: 2

blur-text-image

Step: 3

blur-text-image

Ace Your Homework with AI

Get the answers you need in no time with our AI-driven, step-by-step assistance

Get Started

Recommended Textbook for

Elementary Statisitcs

Authors: Barry Monk

2nd edition

1259345297, 978-0077836351, 77836359, 978-1259295911, 1259295915, 978-1259292484, 1259292487, 978-1259345296

More Books

Students also viewed these Mathematics questions

Question

Make a presentation on Human Visual Research.

Answered: 1 week ago