- Is there a good rationale for raising $30 to $60 million at the time of the case?
- What do you estimate the companys value (total and per share) to be as of March 2007? This does not mean looking back and reading from history. It means estimating value as we have done before projected net cash flows have to be appropriately discounted. Estimate the discount rate. The resultant estimated company value can be checked using market multiples of comparable companies.
- Consider the debt vs. equity discussion.
- How much value would be created if $50 million debt were to be added?
- Would the Weighted Average Cost of Capital change? How?
- What would EPS be under the two alternatives at a low future EBITDA? At a high future EBITDA?
- Is debt or equity preferable?
- What is the condition of the equity markets? Is an IPO at the time of the case a good bet? Which party benefits from the sale?
- Recommend a course of action to Mr. McDonald
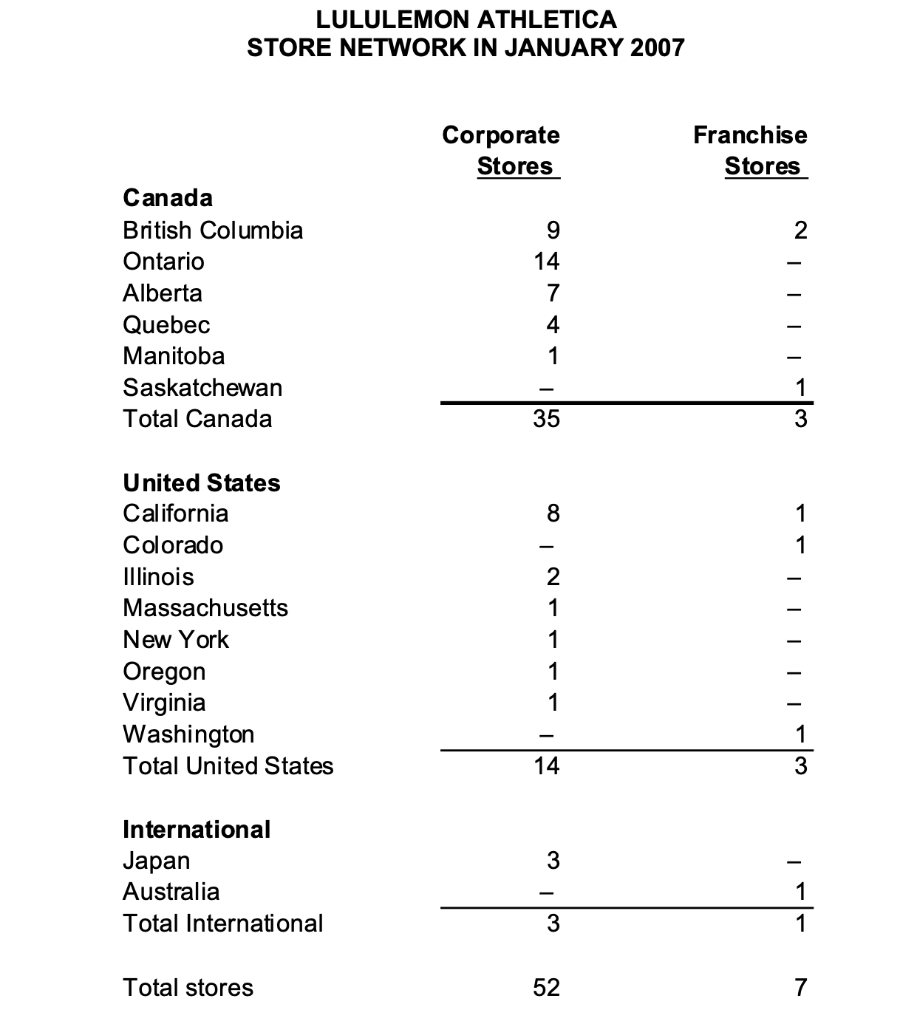
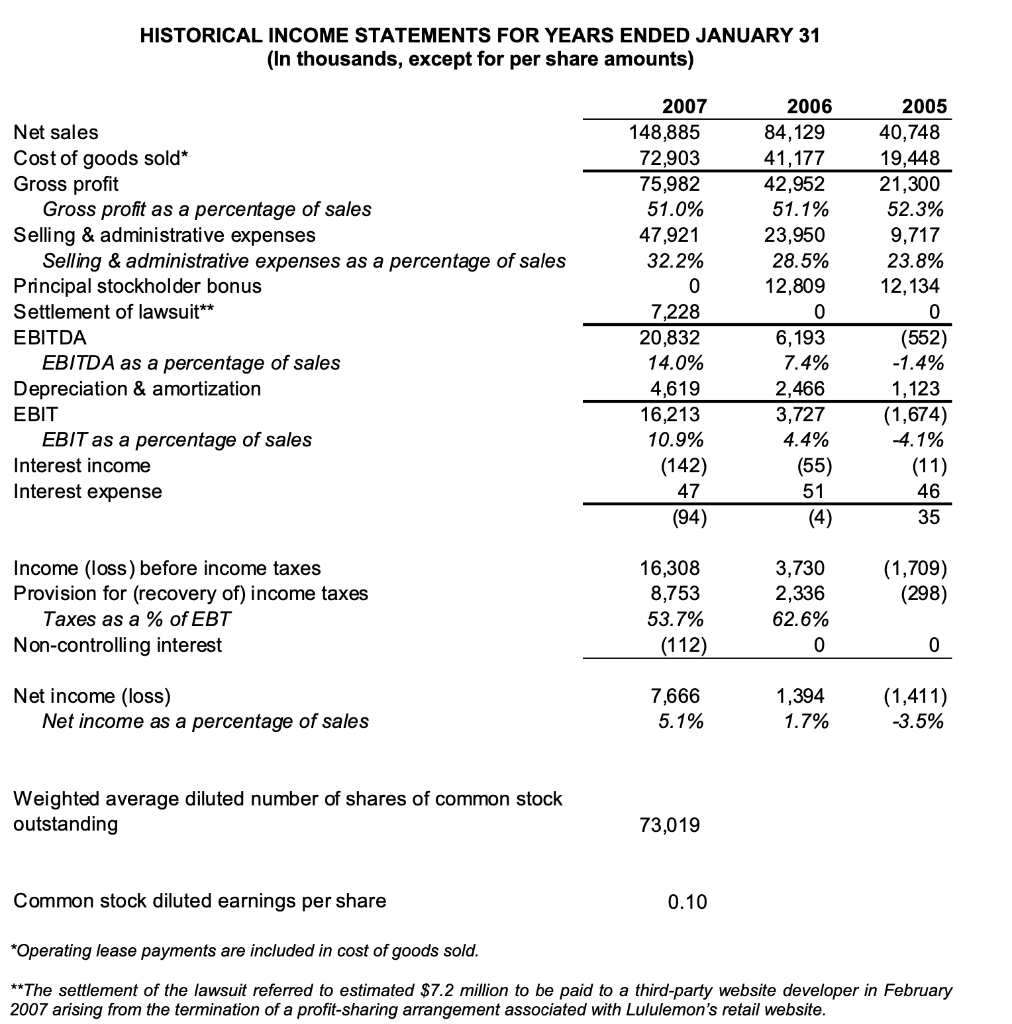
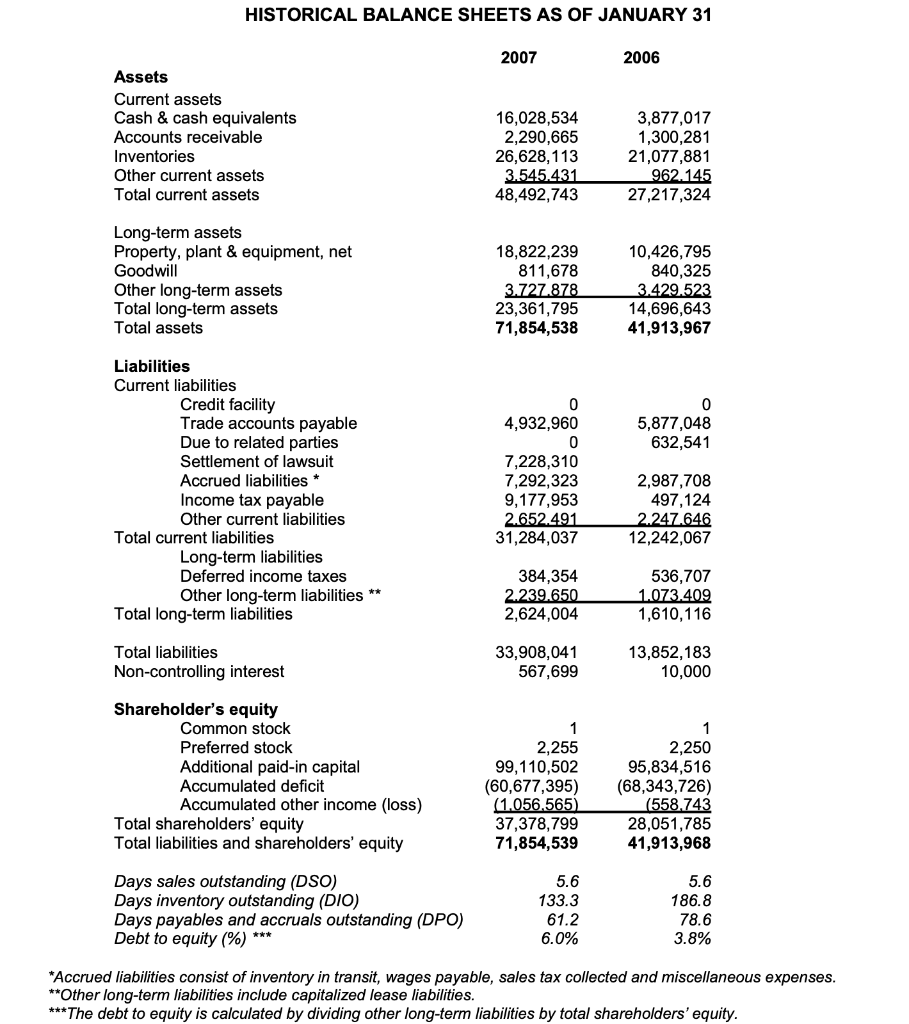
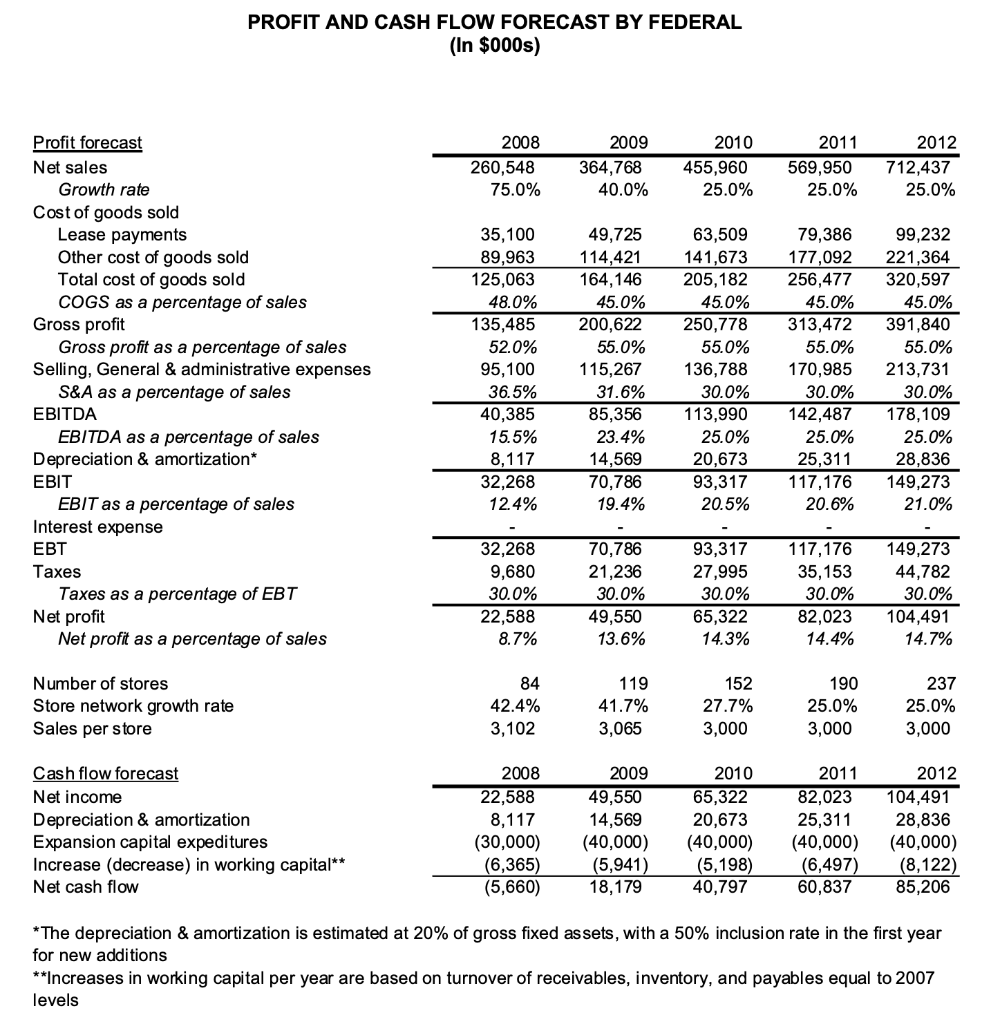
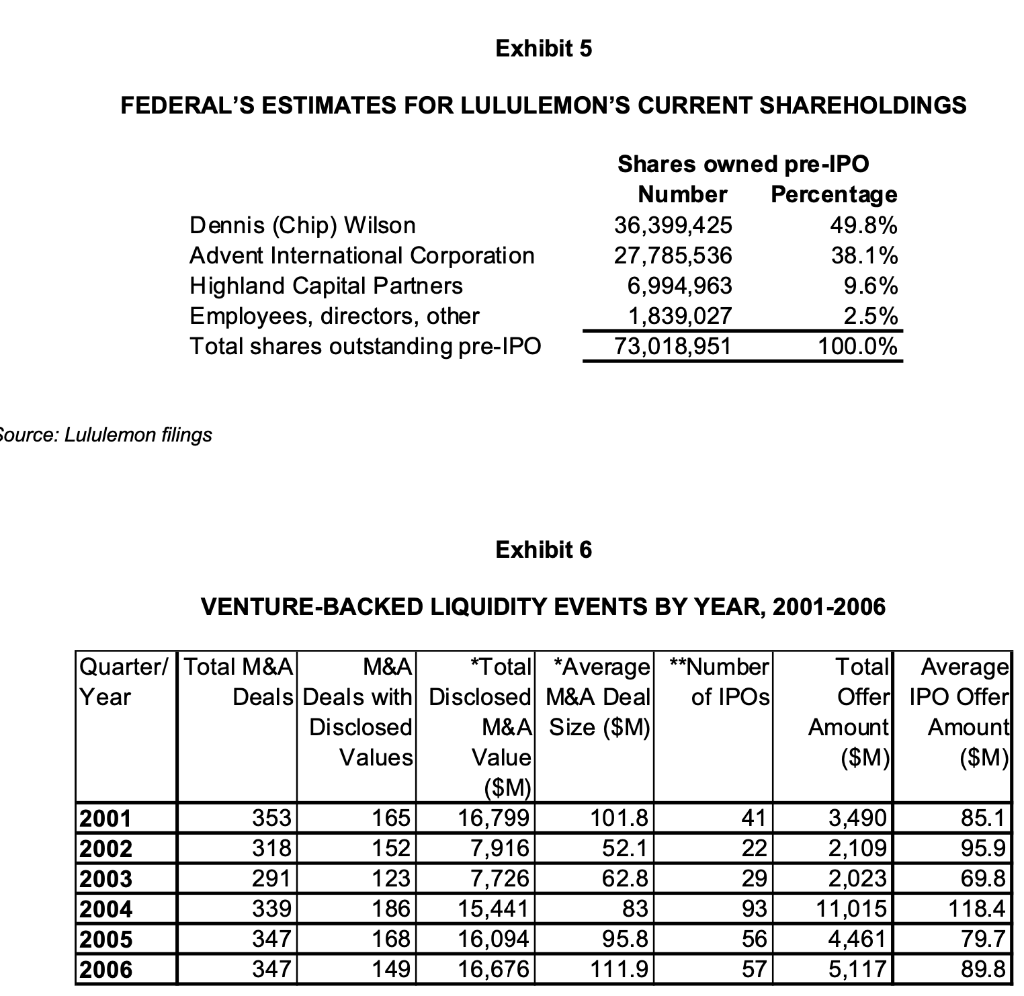
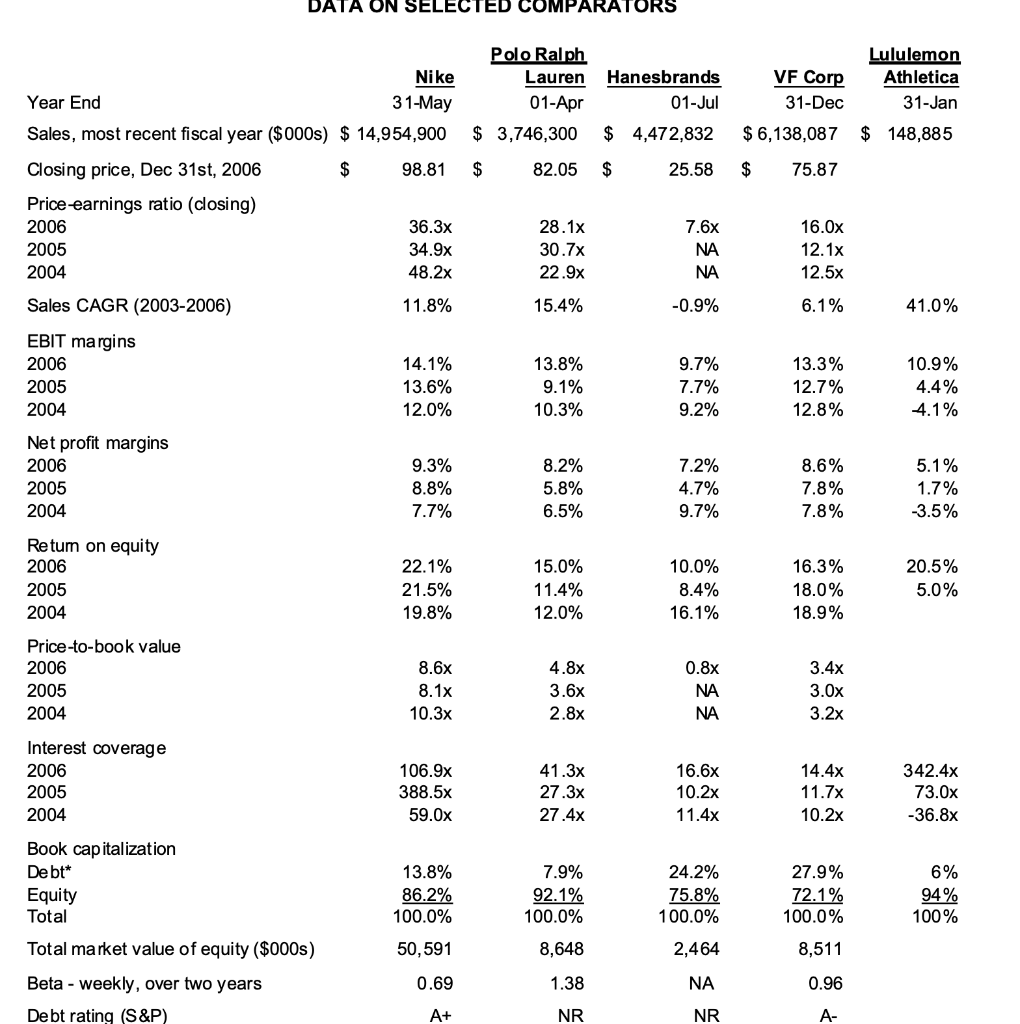
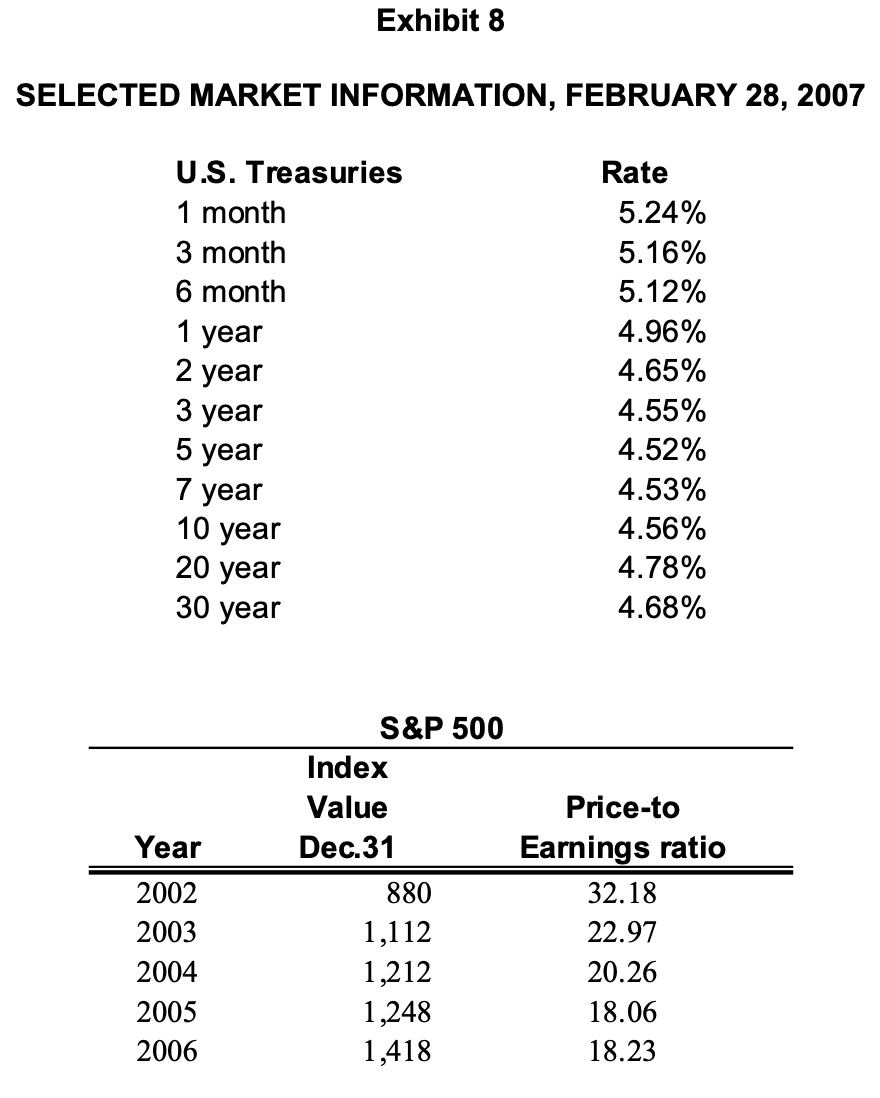
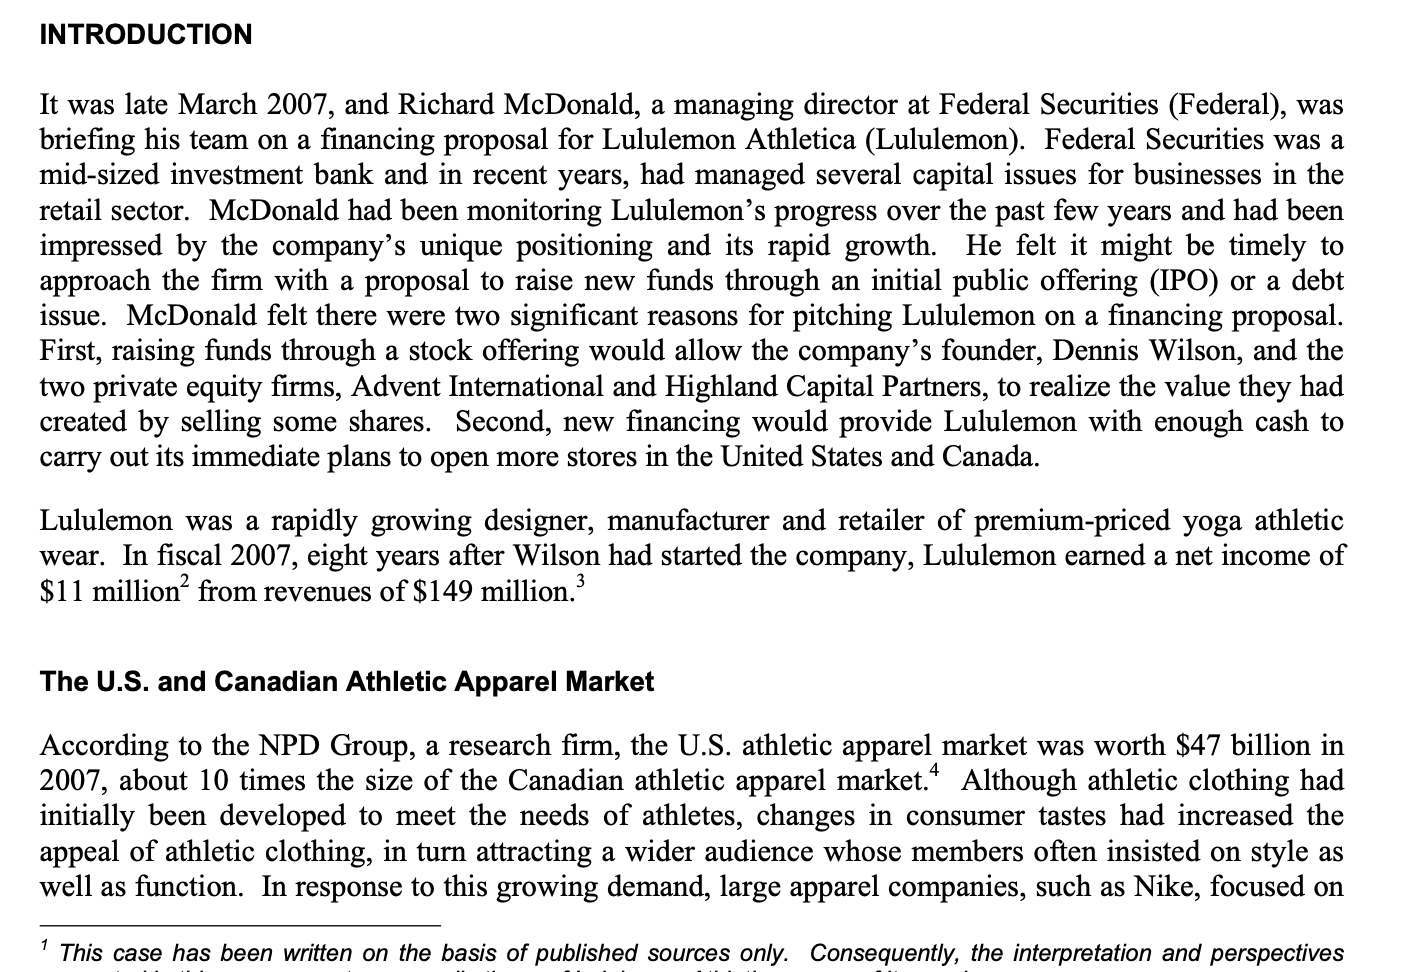

LULULEMON ATHLETICA STORE NETWORK IN JANUARY 2007 Corporate Stores Franchise Stores Canada British Columbia Ontario Alberta Quebec Manitoba Saskatchewan Total Canada wl-IIIIN United States California Colorado Illinois Massachusetts New York Oregon Virginia Washington Total United States W-TITTI on International Japan Australia Total International w 1-1 Total stores HISTORICAL INCOME STATEMENTS FOR YEARS ENDED JANUARY 31 (In thousands, except for per share amounts) 2007 148,885 72,903 75,982 51.0% 47,921 32.2% 2006 84,129 41,177 42,952 51.1% 23,950 28.5% 12,809 0 Net sales Cost of goods sold* Gross profit Gross profit as a percentage of sales Selling & administrative expenses Selling & administrative expenses as a percentage of sales Principal stockholder bonus Settlement of lawsuit** EBITDA EBITDA as a percentage of sales Depreciation & amortization EBIT EBIT as a percentage of sales Interest income Interest expense 2005 40,748 19,448 21,300 52.3% 9,717 23.8% 12,134 0 (552) -1.4% 1,123 (1,674) -4.1% (11) 7,228 20,832 14.0% 4,619 16.213 10.9% (142) 47 (94) 6,193 7.4% 2,466 3,727 4.4% (55) 46 51 (4) 35 Income (loss) before income taxes Provision for (recovery of) income taxes Taxes as a % of EBT Non-controlling interest (1,709) (298) 16,308 8,753 53.7% (112) 3,730 2,336 62.6% 0 Net income (loss) Net income as a percentage of sales 7,666 5.1% 1,394 1.7% (1,411) -3.5% Weighted average diluted number of shares of common stock outstanding 73,019 Common stock diluted earnings per share 0.10 *Operating lease payments are included in cost of goods sold. **The settlement of the lawsuit referred to estimated $7.2 million to be paid to a third-party website developer in February 2007 arising from the termination of a profit-sharing arrangement associated with Lululemon's retail website. HISTORICAL BALANCE SHEETS AS OF JANUARY 31 2007 2006 Assets Current assets Cash & cash equivalents Accounts receivable Inventories Other current assets Total current assets 16,028,534 2,290,665 26,628,113 3.545.431 48,492,743 3,877,017 1,300,281 21,077,881 962.145 27,217,324 Long-term assets Property, plant & equipment, net Goodwill Other long-term assets Total long-term assets Total assets 18,822,239 811,678 3.727.878 23,361,795 71,854,538 10,426,795 840,325 3.429.523 14,696,643 41,913,967 4,932,960 5,877,048 632,541 Liabilities Current liabilities Credit facility Trade accounts payable Due to related parties Settlement of lawsuit Accrued liabilities * Income tax payable Other current liabilities Total current liabilities Long-term liabilities Deferred income taxes Other long-term liabilities ** Total long-term liabilities 7,228,310 7,292,323 9,177,953 2.652.491 31,284,037 2,987,708 497,124 2.247.646 12,242,067 384,354 2.239.650 2,624,004 536,707 1.073.409 1,610,116 Total liabilities Non-controlling interest 33,908,041 567,699 13,852,183 10,000 Shareholder's equity Common stock Preferred stock Additional paid-in capital Accumulated deficit Accumulated other income (loss) Total shareholders' equity Total liabilities and shareholders' equity 2,255 99,110,502 (60,677,395) (1.056.565) 37,378,799 71,854,539 2,250 95,834,516 (68,343,726) (558,743 28,051,785 41,913,968 Days sales outstanding (DSO) Days inventory outstanding (DIO) Days payables and accruals outstanding (DPO) Debt to equity (%) *** 5.6 133.3 61.2 6.0% 5.6 186.8 78.6 3.8% *Accrued liabilities consist of inventory in transit, wages payable, sales tax collected and miscellaneous expenses. **Other long-term liabilities include capitalized lease liabilities. ***The debt to equity is calculated by dividing other long-term liabilities by total shareholders' equity. PROFIT AND CASH FLOW FORECAST BY FEDERAL (In $000s) 2008 260,548 75.0% 2009 364,768 40.0% 2010 455,960 25.0% 2011 569,950 25.0% 2012 712,437 25.0% 40.0 Profit forecast Net sales Growth rate Cost of goods sold Lease payments Other cost of goods sold Total cost of goods sold COGS as a percentage of sales Gross profit Gross profit as a percentage of sales Selling, General & administrative expenses S&A as a percentage of sales EBITDA EBITDA as a percentage of sales Depreciation & amortization* EBIT EBIT as a percentage of sales Interest expense EBT Taxes Taxes as a percentage of EBT Net profit Net profit as a percentage of sales 35, 100 89,963 125,063 48.0% 135,485 52.0% 95,100 36.5% 40,385 15.5% 8,117 32,268 12.4% 49,725 114,421 164,146 45.0% 200,622 55.0% 115,267 31.6% 85,356 23.4% 14,569 70,786 19.4% 63,509 141,673 205,182 45.0% 250,778 55.0% 136,788 30.0% 113,990 25.0% 20,673 93,317 20.5% 79,386 177,092 256,477 45.0% 313,472 55.0% 170,985 30.0% 142,487 25.0% 25,311 117,176 20.6% 99,232 221,364 320,597 45.0% 391,840 55.0% 213,731 30.0% 178,109 25.0% 28,836 149,273 21.0% 32,268 9,680 30.0% 22,588 8.7% 70,786 21,236 30.0% 49,550 13.6% 93,317 27,995 30.0% 65,322 14.3% 117,176 35,153 30.0% 82,023 14.4% 149,273 44,782 30.0% 104,491 14.7% Number of stores Store network growth rate Sales per store 84 42.4% 3,102 119 41.7% 3,065 152 27.7% 3,000 190 25.0% 3,000 237 25.0% 3,000 Cash flow forecast Net income Depreciation & amortization Expansion capital expeditures Increase (decrease) in working capital** Net cash flow 2008 22,588 8,117 (30,000) (6,365) (5,660) 2009 49,550 14,569 (40,000) (5,941) 18,179 2010 65,322 20,673 (40,000) (5,198) 40,797 2011 82,023 25,311 (40,000) (6,497) 60,837 2012 104,491 28,836 (40,000) (8,122) 85,206 *The depreciation & amortization is estimated at 20% of gross fixed assets, with a 50% inclusion rate in the first year for new additions **Increases in working capital per year are based on turnover of receivables, inventory, and payables equal to 2007 levels Exhibit 5 FEDERAL'S ESTIMATES FOR LULULEMON'S CURRENT SHAREHOLDINGS Dennis (Chip) Wilson Advent International Corporation Highland Capital Partners Employees, directors, other Total shares outstanding pre-IPO Shares owned pre-IPO Number Percentage 36,399,425 49.8% 27,785,536 38.1% 6,994,963 9.6% 1,839,027 2.5% 73,018,951 100.0% Source: Lululemon filings Exhibit 6 VENTURE-BACKED LIQUIDITY EVENTS BY YEAR, 2001-2006 Quarter/ Total M&A M&A *Total Average **Number Total Average Year Deals Deals with Disclosed M&A Deal of IPOs Offer IPO Offer Disclosed M&A Size ($M) Amount Amount Values Value ($M) ($M) ($M) 2001 353 165 16,799 101.8 3,490 85.1 2002 318 152 7,916 52.1 22 2,109 95.9 2003 291 123 7,726 62.8 29 2,023 69.8 2004 339 186 15,441 83 93 11,015 118.4 2005 347 168 16,094 95.8 564,461) 79.7 2006 347 149 16,676 111.9| 57 5,117 89.8 41 1231 461 DATA ON SELECTED COMPARATORS VF Corp Polo Ralph Lauren Hanesbrands 01-Apr 01-Jul $ 3,746,300 $ 4,472,832 $ 82.05 $ 25.58 Lululemon Athletica 31-Jan $ 148,885 $6,138,087 $ 75.87 28.1x 7.6x Nike Year End 31-May Sales, most recent fiscal year ($000s) $ 14,954,900 Closing price, Dec 31st, 2006 $ 98.81 Price earnings ratio (closing) 2006 36.3x 2005 34.9x 2004 48.2x Sales CAGR (2003-2006) 11.8% EBIT margins 2006 14.1% 2005 13.6% 2004 12.0% 30.7% 22.9x NA NA 16.0x 12.1x 12.5x 15.4% -0.9% 6.1% 41.0% 13.8% 9.1% 10.3% 9.7% 7.7% 9.2% 13.3% 12.7% 12.8% 10.9% 4.4% 4.1% 9.3% Net profit margins 2006 2005 2004 8.8% 7.7% 8.2% 5.8% 6.5% 7.2% 4.7% 9.7% 8.6% 7.8% 7.8% 5.1% 1.7% -3.5% Retum on equity 2006 2005 2004 22.1% 21.5% 19.8% 15.0% 11.4% 12.0% 10.0% 8.4% 16.1% 16.3% 18.0% 18.9% 20.5% 5.0% 3.4x Price-to-book value 2006 2005 2004 8.6x 8.1x 10.3x 4.8x 3.6x 2.8% 0.8x NA NA 3.0x 3.2x Interest coverage 2006 2005 2004 106.9x 388.5x 59.0x 41.3x 27.3x 27.4x 16.6x 10.2x 11.4x 14.4x 11.7x 10.2x 342.4x 73.0x -36.8x Book capitalization De bt* Equity Total 7.9% 92.1% 100.0% 24.2% 75.8% 100.0% 2,464 27.9% 72.1% 100.0% 13.8% 86.2% 100.0% 50,591 0.69 6% 94% 100% 8,648 8,511 Total market value of equity ($000s) Beta - weekly, over two years Debt rating (S&P) 1.38 NA 0.96 A+ NR NR A- Exhibit 8 SELECTED MARKET INFORMATION, FEBRUARY 28, 2007 U.S. Treasuries 1 month 3 month 6 month 1 year 2 year 3 year 5 year 7 year 10 year 20 year 30 year Rate 5.24% 5.16% 5.12% 4.96% 4.65% 4.55% 4.52% 4.53% 4.56% 4.78% 4.68% Year 2002 2003 2004 2005 2006 S&P 500 Index Value Dec.31 880 1,112 1,212 1,248 1,418 Price-to Earnings ratio 32.18 22.97 20.26 18.06 18.23 INTRODUCTION It was late March 2007, and Richard McDonald, a managing director at Federal Securities (Federal), was briefing his team on a financing proposal for Lululemon Athletica (Lululemon). Federal Securities was a mid-sized investment bank and in recent years, had managed several capital issues for businesses in the retail sector. McDonald had been monitoring Lululemon's progress over the past few years and had been impressed by the company's unique positioning and its rapid growth. He felt it might be timely to approach the firm with a proposal to raise new funds through an initial public offering (IPO) or a debt issue. McDonald felt there were two significant reasons for pitching Lululemon on a financing proposal. First, raising funds through a stock offering would allow the company's founder, Dennis Wilson, and the two private equity firms, Advent International and Highland Capital Partners, to realize the value they had created by selling some shares. Second, new financing would provide Lululemon with enough cash to carry out its immediate plans to open more stores in the United States and Canada. Lululemon was a rapidly growing designer, manufacturer and retailer of premium-priced yoga athletic wear. In fiscal 2007, eight years after Wilson had started the company, Lululemon earned a net income of $11 million from revenues of $149 million. The U.S. and Canadian Athletic Apparel Market According to the NPD Group, a research firm, the U.S. athletic apparel market was worth $47 billion in 2007, about 10 times the size of the Canadian athletic apparel market.* Although athletic clothing had initially been developed to meet the needs of athletes, changes in consumer tastes had increased the appeal of athletic clothing, in turn attracting a wider audience whose members often insisted on style as well as function. In response to this growing demand, large apparel companies, such as Nike, focused on * This case has been written on the basis of published sources only. Consequently, the interpretation and perspectives designing stylish clothing from technical fabrics that could repel rain, allow perspiration vapour to escape, and wick moisture away from skin. Apparel designs were often developed in the United States and Europe and were usually manufactured in low-cost countries, such as China, Honduras and Vietnam. As new apparel lines were constantly being introduced, advertising stood out as the key to driving sales. Athletic apparel was sold through mass merchandisers, department stores and specialty goods stores. Some brand-name firms, such as Nike, had their own stores. Women purchased more than 80 per cent of athletic apparel, and some of the fastest growing athletic apparel categories involved low-impact group sports and activities such as walking and yoga. Competition in the market was increasing as high-end fashion brands such as Ralph Lauren, Prada and Tommy Hilfiger started to introduce athletic apparel into their lineups. LULULEMON ATHLETICA Chip Wilson had been involved in the apparel industry since 1979, setting up his first Lululemon Athletica store in the trendy Vancouver neighbourhood of Kitsilano. To attract customers, Wilson began his operations by stocking the store with well-known branded apparel, in addition to the newly designed Lululemon products. As customers browsed the store, Wilson sought feedback on Lululemon's first design prototypes. He had located his design studio in the middle of the store so prototypes could be altered on the spot. Wilson built up a small line-up of clothing, producing pieces in small batches in order to minimize risk. The top-selling item was the Lululemon pant, made from form-fitting Lycra. Lululemon offered feminine, high-quality clothing that fit most body types. The target consumer was an early 30s professional woman who was well educated and had significant disposable income. Wilson relied on his contacts in the fabric industry to procure fabrics for his active wear. To further differentiate Lululemon's products, Wilson developed proprietary fabrics such as Silverescent, Vitasea, and Luon. Silverescent incorporated silver particles because of its anti-bacterial properties. Vitasea was a fabric developed from a seaweed compound. According to Lululemon, it released amino acids, minerals and vitamins directly into the skin. Luon was a fabric that wicked away moisture, was flexible and was designed to reduce irritation." The design process included gathering extensive customer feedback through the use of focus groups and in-store surveys. Lululemon maintained a research-and-development room at its headquarters, where hundreds of potential product designs were stored. Clothing destined for North American stores was manufactured in two independent facilities in Vancouver in which Lululemon had a minority equity stake. Having a design facility, stores and a manufacturing facility located near headquarters meant that Lululemon could make last-minute changes to product designs and alterations to production levels, depending on sales volume. To reduce shipment time and product costs, clothing destined for Asia-Pacific stores was produced in China by Lululemon's Vancouver manufacturing partners. Clothing designs were manufactured in small batches about 1,000 pieces per batch and inventories at the store level were checked and replenished every 45 days. There was a testing period when new products were launched. If products sold well, they were added to the regular lineup. Lululemon's success allowed Wilson to add stores across Canada, the United States, Australia and Japan. By 2007, the company operated 59 retail stores in total. Seven of these stores were owned by franchisees (see Exhibit 1). Lululemon garments were also made available at wholesale prices to retailers in non- competing territories. Stores were typically 2,500 square feet in size and located near other high-end retailers that were targeting the same customer group. For example, Lululemon stores could be found on main shopping streets, in higher-end malls next to retailers such as Banana Republic, The Gap, and even Gucci and other specialty retailers such as organic food markets. Lululemon employed 650 part-time and full-time workers in its stores. Employees were hired based on their customer service orientation and attitude. Retail floor employees were called "educators," and their goals were to greet customers with a smile, provide cheerful advice and educate the consumer on the technical aspects of each garment. These educators were even encouraged to tell guests when a garment they were trying on did not fit the way it was designed to or when it was unflattering to the customer. Lululemon paid its retail employees an hourly wage 30 per cent higher than the minimum wage offered by most retailers. Management was encouraged to deal with staff on a transparent basis and incorporate employee input wherever possible. Lululemon's part-time employee turnover was about 20 per cent per year, considerably lower than the retail industry average of over 50 per cent. To promote its stores and products, Lululemon relied on word-of-mouth advertising and on local endorsements. Each store appointed a "community educator" who recruited about six brand ambassadors for the store. Ambassadors were selected based on their level of connection and prominence in the local athletic community; they were given free clothing to wear, but they did not have any formal requirement to promote the brand. In stores, photographs featuring these local ambassadors were prominently displayed. In addition, Lululemon held selected events to draw crowds to its stores. For example, in Vancouver, Lululemon gave away free clothing to the first few people who showed up naked at a new store opening. Due to its growing popularity, Lululemon's products were a favourite topic for local and national media outlets, garnering free publicity for the firm. The company typically spent one per cent of sales on marketing Competitors Lululemon capitalized on its first-mover advantage to expand rapidly. The company had been uniquely positioned in the market before its success caught the attention of Canadian retailers. Several competitors started to augment their product line with look-alike clothing. For example, retailers like Aritzia and Roots - both Canadian firms added yoga-inspired clothing that was loosely based on Lululemon's designs. Aritzia was based in Vancouver and had 55 stores mainly in Canada (with six stores in the United States). Aritzia's yoga apparel, which was developed to augment its product line-up, seemed to copy style elements from Lululemon's collection. As a Canadian retailer that sold outdoor-style clothing such as sweatshirts, cargo pants and jackets, Roots had 120 stores in Canada, the United States and Asia. It too had recently added a small section of yoga-inspired clothing. Lululemon also competed against several other, smaller, yoga-clothing retailers, such as Kharma Athletics, Lotuswear and Tonic. Kharma Athletics started up in 2002 in Vancouver as a manufacturer of yoga clothing that was fashionable and colourful. Lotuswear was founded in 2004 and differentiated its brand from those of its competitors by promoting a particular focus on environmental and social consciousness. Tonic was founded in 2004 and created fashionable yoga clothing. None of these competitors could match Lululemon's record for growth or its expansive network of nearly 60 stores. However, serious competition could come from large companies such as Nike, Polo Ralph Lauren, Hanesbrands or VF Corp. Nike was the global leader in athletic shoes and apparel, with a market capitalization of $51 billion and 675 company-owned stores. It designed, developed and marketed footwear, apparel, equipment and accessory products and used proprietary fabrics such as Dri-FIT, that were designed to be cool, breathable and moisture-wicking. Nike designed women's athletic apparel for a range of sports and had just launched a line of yoga-specific items. Nike promoted its products by sponsoring sporting events and focusing on key athletes, as well as using extensive advertising; for example, in 2006, the company spent $678 million on advertising in the U.S. market. Its promotional efforts included sponsoring events and key athletes. Polo Ralph Lauren was a designer and distributor of lifestyle branded apparel. It designed and sold products to retailers through about 1,950 upscale department stores and through its own network of 282 specialty stores. The company enjoyed strong brand equity for its higher-end apparel and boasted nearly a million customers on its e-commerce website, polo.com. Hanesbrands was a clothing company that was spun off by the Sara Lee Corporation in September 2006. With $431 million in annual sales, its flagship Hanes brand produced, among other things, active wear such as performance T-shirts and shorts, and casual wear such as T-shirts, fleece and sports shirts. Its second largest brand, Champion, was well-known as an urban fashion brand. The brand had a history of innovation, inventing the sports bra and reversible t- shirts. VF Corp. had more than $6 billion in revenues in 2006 and was the world's largest apparel company. It had a stable of brands targeted at younger consumers including North Face, Vans, JanSport, Wrangler, Lee, Nautica and other brands. While it seemed as if many clothing retailers were adding similar form-fitting, Lycra-based clothing, McDonald felt that Lululemon continued to enjoy the top spot in terms of brand image. He did not feel that increased competition was a major threat since Lululemon continued to be innovative by launching new products and updating its lineup frequently. Financial Performance Exhibits 2 and 3 show Lululemon's recent historical financial statements. The company had financed its expansion largely through new equity investments and internal funds. Its capital needs remained low as a result of renting (rather than owning) stores and carefully managing inventory levels. Customers made their purchases with guaranteed funds (i.e., cash or debit cards or credit cards), and suppliers were paid within 30 to 45 days. At the end of fiscal 2007, Lululemon had little debt outstanding other than capitalized leases. The interest expense reported on the income statement indicated the company has used debt financing during the year; however, no debt was outstanding at the end of the fiscal year. REALIZING VALUE AND SECURING CASH FOR FUTURE GROWTH Key Shareholders In December 2005, Wilson sold 48 per cent of Lululemon to Advent International (Advent) and Highland Capital Partners (HCP) for a total of $93 million. He took a step back from active management, appointing former Reebok chief executive officer (CEO) and Advent operating partner Robert Meers as CEO of Lululemon. At Reebok, over a period of 15 years, Meers had grown sales from $13 million to $3.5 billion. Wilson now owned 49.8 per cent of the firm, with another 2.5 per cent owned by Lululemon employees and directors. In media articles, Lululemon management had indicated that it would open 25 more stores in 2007 and another 30 to 35 stores in 2008. This increase in the store network would drive sales as well as capital expenditures. McDonald estimated that as the company added stores, it would become more efficient with its capital budget for each new store: store designs could be repeated, Lululemon's brand could drive better lease terms, and leasehold improvements could be purchased in bulk. In spite of the fact that Lululemon stated it was expecting high sales growth in its current stores, the company did not provide any details of its growth plans beyond the next two years. However, McDonald and his team began building a financial forecast based on their own estimates and on conversations with industry observers and research analysts (see Exhibit 4). From fiscal year 2010 to fiscal year 2012, an annual growth of 25 per cent would translate into an addition of between 35 and 47 stores per year. As each store established itself within the community, its revenues would continue to rise as the customer base grew and the merchandise mix was optimized to match local needs. Hence, the rapidly expanding company would have, for the next few years, a portfolio consisting of new stores and maturing stores. New-store sales were generally lower than sales from mature stores i.e., stores that had been established for three years or longer). For forecasting purposes, the average sales per store within the company's entire portfolio of new and mature stores were estimated to be about $3 million per year. Lululemon's cost of goods sold could be lowered to about 45 per cent, as efficiencies were reaped in manufacturing and in the negotiation of leases. By 2009, cost savings from higher volumes would be partly offset by additional costs such as insurance and storage. The Federal team estimated that Lululemon could reduce its selling and administration expenses down to about 30 per cent a year by 2010, as its sales volumes grew faster than its supporting sales and administrative infrastructure. Capital expenditures were expected to grow in tandem with Lululemon's store network. However, new store costs were expected to benefit from increased purchasing power for industrial supplies, driving down the costs involved in leasehold improvements per store. Federal estimated that capital expenditures for new stores, current stores and corporate improvements would average $40 million a year for 2009 and beyond. Lululemon's tax rate had been very high in the last two years due to unusual tax items and Federal expected the company's tax rate would approach normal levels of 30 per cent in the future. Risks In spite of the optimistic forecast, there were a variety of risks to consider. Lululemon intended to expand primarily in the highly competitive U.S. market. The consumer had many choices for active wear or sportswear, and competitors had been keeping an eye on Lululemon for the past few years. Lululemon expected to gain market share as it opened up new stores, but there were risks that revenue growth could slow if competitors managed to gain traction with their own active wear brands. In addition, while yoga was growing in popularity, another sport or activity could emerge to displace it, potentially drawing away consumers. Federal estimated that, in a pessimistic scenario, Lululemon's growth rate could slow to 20 per cent per year, with a corresponding decrease in its store footprint growth rate. The cost of leases was rising along with the price of real estate. In addition, Lululemon had to rapidly hire new employees and implement new systems to manage the increased flow of goods. The company would likely incur much higher store-operating expenses as a result, which could more than offset gains in In media articles, Lululemon management had indicated that it would open 25 more stores in 2007 and another 30 to 35 stores in 2008. This increase in the store network would drive sales as well as capital expenditures. McDonald estimated that as the company added stores, it would become more efficient with its capital budget for each new store: store designs could be repeated, Lululemon's brand could drive better lease terms, and leasehold improvements could be purchased in bulk. In spite of the fact that Lululemon stated it was expecting high sales growth in its current stores, the company did not provide any details of its growth plans beyond the next two years. However, McDonald and his team began building a financial forecast based on their own estimates and on conversations with industry observers and research analysts (see Exhibit 4). From fiscal year 2010 to fiscal year 2012, an annual growth of 25 per cent would translate into an addition of between 35 and 47 stores per year. As each store established itself within the community, its revenues would continue to rise as the customer base grew and the merchandise mix was optimized to match local needs. Hence, the rapidly expanding company would have, for the next few years, a portfolio consisting of new stores and maturing stores. New-store sales were generally lower than sales from mature stores i.e., stores that had been established for three years or longer). For forecasting purposes, the average sales per store within the company's entire portfolio of new and mature stores were estimated to be about $3 million per year. Lululemon's cost of goods sold could be lowered to about 45 per cent, as efficiencies were reaped in manufacturing and in the negotiation of leases. By 2009, cost savings from higher volumes would be partly offset by additional costs such as insurance and storage. The Federal team estimated that Lululemon could reduce its selling and administration expenses down to about 30 per cent a year by 2010, as its sales volumes grew faster than its supporting sales and administrative infrastructure. Capital expenditures were expected to grow in tandem with Lululemon's store network. However, new store costs were expected to benefit from increased purchasing power for industrial supplies, driving down the costs involved in leasehold improvements per store. Federal estimated that capital expenditures for new stores, current stores and corporate improvements would average $40 million a year for 2009 and beyond. Lululemon's tax rate had been very high in the last two years due to unusual tax items and Federal expected the company's tax rate would approach normal levels of 30 per cent in the future. Risks In spite of the optimistic forecast, there were a variety of risks to consider. Lululemon intended to expand primarily in the highly competitive U.S. market. The consumer had many choices for active wear or sportswear, and competitors had been keeping an eye on Lululemon for the past few years. Lululemon expected to gain market share as it opened up new stores, but there were risks that revenue growth could slow if competitors managed to gain traction with their own active wear brands. In addition, while yoga was growing in popularity, another sport or activity could emerge to displace it, potentially drawing away consumers. Federal estimated that, in a pessimistic scenario, Lululemon's growth rate could slow to 20 per cent per year, with a corresponding decrease in its store footprint growth rate. The cost of leases was rising along with the price of real estate. In addition, Lululemon had to rapidly hire new employees and implement new systems to manage the increased flow of goods. The company would likely incur much higher store-operating expenses as a result, which could more than offset gains in expense management. In a pessimistic scenario, the Federal team felt that selling and administration expenses could rise back to 35 per cent per year. There were macroeconomic risks as well. At the start of 2007, the U.S. economy was slowing because of a downturn in the housing market. U.S. gross domestic product (GDP) growth was 3.2 per cent in 2005 and 3.3 per cent in 2006 but was forecast to be 2.3 per cent for 2007 and 2.6 per cent for 2008. The unemployment rate was 4.6 per cent in 2006, lower than the historical average of about 5.7 per cent.' According to the Economist Intelligence Unit's report in January 2007: We expect growth in private consumption to be 2.7 per cent in 2007, compared with 3.5 per cent in 2004-06. The wealth effect from rising house prices is no longer boosting consumer spending, and the decline in the household savings rate is already starting to reverse although it remains negative at the moment. In addition, housing equity withdrawal, a key driver of consumer demand in 2004-05 and in early 2006 will decline substantially. All these factors will depress private consumption in 2007. The same pressures will linger into 2008, as consumers continue to rebuild their balance sheets. Canadian GDP growth was 2.9 per cent in 2005 and 2.7 in 2006, and it was forecast to slow to 2.2 per cent in 2007 as a result of a slowing U.S. economy.' The Federal team felt there was significant potential for Lululemon to become a leading U.S. retailer. If Lululemon were to offer about five million new shares in addition to a secondary offering by its major investors, it could raise roughly $30 million to $60 million to fund its expansion plans," said McDonald to his team of associates and analysts. Exhibit 5 shows the current shareholder holdings for Lululemon. Market Conditions At the start of 2007, the stock markets seemed to be performing strongly. In 2006, the S&P index had generated total annual return of 15.8 per cent, well above historical averages of about 10 per cent. Venture-backed IPOs performed very strongly in 2006, recording the second best year for IPOs in the past six years (see Exhibit 6): The current time seems to be a great window of opportunity to do an IPO," stated McDonald. Exhibit 7 provides data on selected comparator companies to Lululemon, and selected market information can be found in Exhibit 8. McDonald realized that one and a half years was a short period of time for a private equity firm to turn around and sell an investment, but he felt that Lululemon's investors might want to realize some of the gains in value that Lululemon's success had generated. They might be entertaining other private investment opportunities, and realizing some gains from Lululemon might help them diversify their portfolio." McDonald thought Lululemon's management and shareholders might want to delay an IPO until higher profits and a record of growth in the United States could produce a higher offering price for a stock issue. had no long-term debt, aside from capitalized leases, and its profit record could support a higher leverage ratio. If Lululemon were to raise $30 million to $60 million in the form of debt, with a term of 10 years, McDonald felt it would likely pay 6.25 per cent in interest per annum, which was the same rate as the yield on investment grade rated (Baa) corporate bonds in February 2007. The U.S. 10-year treasuries were currently yielding 4.56 per cent (see Exhibit 8). If $50 million were borrowed, the annual principal payments would amount to $5 million. The loan would be secured against Lululemon's long-term assets. Other covenants for the debt would likely preclude additional debt, set a limit on capital expenditures above currently planned amounts, and restrict loans and dividends to shareholders. McDonald realized that a $50 million issue of new stock or debt would cause Lululemon's capital structure to temporarily deviate from the company's long-term target leverage ratio that he felt would approximate the industry average of 20 per cent debt and 80 per cent equity. THE TASK McDonald addressed his team: Let's work to clarify the rationale for each of the options and value the company as a first step in proposing a price range for an IPO. Lululemon is a great story of growth and profitability and will no doubt be actively pursued by other investment banks. LULULEMON ATHLETICA STORE NETWORK IN JANUARY 2007 Corporate Stores Franchise Stores Canada British Columbia Ontario Alberta Quebec Manitoba Saskatchewan Total Canada wl-IIIIN United States California Colorado Illinois Massachusetts New York Oregon Virginia Washington Total United States W-TITTI on International Japan Australia Total International w 1-1 Total stores HISTORICAL INCOME STATEMENTS FOR YEARS ENDED JANUARY 31 (In thousands, except for per share amounts) 2007 148,885 72,903 75,982 51.0% 47,921 32.2% 2006 84,129 41,177 42,952 51.1% 23,950 28.5% 12,809 0 Net sales Cost of goods sold* Gross profit Gross profit as a percentage of sales Selling & administrative expenses Selling & administrative expenses as a percentage of sales Principal stockholder bonus Settlement of lawsuit** EBITDA EBITDA as a percentage of sales Depreciation & amortization EBIT EBIT as a percentage of sales Interest income Interest expense 2005 40,748 19,448 21,300 52.3% 9,717 23.8% 12,134 0 (552) -1.4% 1,123 (1,674) -4.1% (11) 7,228 20,832 14.0% 4,619 16.213 10.9% (142) 47 (94) 6,193 7.4% 2,466 3,727 4.4% (55) 46 51 (4) 35 Income (loss) before income taxes Provision for (recovery of) income taxes Taxes as a % of EBT Non-controlling interest (1,709) (298) 16,308 8,753 53.7% (112) 3,730 2,336 62.6% 0 Net income (loss) Net income as a percentage of sales 7,666 5.1% 1,394 1.7% (1,411) -3.5% Weighted average diluted number of shares of common stock outstanding 73,019 Common stock diluted earnings per share 0.10 *Operating lease payments are included in cost of goods sold. **The settlement of the lawsuit referred to estimated $7.2 million to be paid to a third-party website developer in February 2007 arising from the termination of a profit-sharing arrangement associated with Lululemon's retail website. HISTORICAL BALANCE SHEETS AS OF JANUARY 31 2007 2006 Assets Current assets Cash & cash equivalents Accounts receivable Inventories Other current assets Total current assets 16,028,534 2,290,665 26,628,113 3.545.431 48,492,743 3,877,017 1,300,281 21,077,881 962.145 27,217,324 Long-term assets Property, plant & equipment, net Goodwill Other long-term assets Total long-term assets Total assets 18,822,239 811,678 3.727.878 23,361,795 71,854,538 10,426,795 840,325 3.429.523 14,696,643 41,913,967 4,932,960 5,877,048 632,541 Liabilities Current liabilities Credit facility Trade accounts payable Due to related parties Settlement of lawsuit Accrued liabilities * Income tax payable Other current liabilities Total current liabilities Long-term liabilities Deferred income taxes Other long-term liabilities ** Total long-term liabilities 7,228,310 7,292,323 9,177,953 2.652.491 31,284,037 2,987,708 497,124 2.247.646 12,242,067 384,354 2.239.650 2,624,004 536,707 1.073.409 1,610,116 Total liabilities Non-controlling interest 33,908,041 567,699 13,852,183 10,000 Shareholder's equity Common stock Preferred stock Additional paid-in capital Accumulated deficit Accumulated other income (loss) Total shareholders' equity Total liabilities and shareholders' equity 2,255 99,110,502 (60,677,395) (1.056.565) 37,378,799 71,854,539 2,250 95,834,516 (68,343,726) (558,743 28,051,785 41,913,968 Days sales outstanding (DSO) Days inventory outstanding (DIO) Days payables and accruals outstanding (DPO) Debt to equity (%) *** 5.6 133.3 61.2 6.0% 5.6 186.8 78.6 3.8% *Accrued liabilities consist of inventory in transit, wages payable, sales tax collected and miscellaneous expenses. **Other long-term liabilities include capitalized lease liabilities. ***The debt to equity is calculated by dividing other long-term liabilities by total shareholders' equity. PROFIT AND CASH FLOW FORECAST BY FEDERAL (In $000s) 2008 260,548 75.0% 2009 364,768 40.0% 2010 455,960 25.0% 2011 569,950 25.0% 2012 712,437 25.0% 40.0 Profit forecast Net sales Growth rate Cost of goods sold Lease payments Other cost of goods sold Total cost of goods sold COGS as a percentage of sales Gross profit Gross profit as a percentage of sales Selling, General & administrative expenses S&A as a percentage of sales EBITDA EBITDA as a percentage of sales Depreciation & amortization* EBIT EBIT as a percentage of sales Interest expense EBT Taxes Taxes as a percentage of EBT Net profit Net profit as a percentage of sales 35, 100 89,963 125,063 48.0% 135,485 52.0% 95,100 36.5% 40,385 15.5% 8,117 32,268 12.4% 49,725 114,421 164,146 45.0% 200,622 55.0% 115,267 31.6% 85,356 23.4% 14,569 70,786 19.4% 63,509 141,673 205,182 45.0% 250,778 55.0% 136,788 30.0% 113,990 25.0% 20,673 93,317 20.5% 79,386 177,092 256,477 45.0% 313,472 55.0% 170,985 30.0% 142,487 25.0% 25,311 117,176 20.6% 99,232 221,364 320,597 45.0% 391,840 55.0% 213,731 30.0% 178,109 25.0% 28,836 149,273 21.0% 32,268 9,680 30.0% 22,588 8.7% 70,786 21,236 30.0% 49,550 13.6% 93,317 27,995 30.0% 65,322 14.3% 117,176 35,153 30.0% 82,023 14.4% 149,273 44,782 30.0% 104,491 14.7% Number of stores Store network growth rate Sales per store 84 42.4% 3,102 119 41.7% 3,065 152 27.7% 3,000 190 25.0% 3,000 237 25.0% 3,000 Cash flow forecast Net income Depreciation & amortization Expansion capital expeditures Increase (decrease) in working capital** Net cash flow 2008 22,588 8,117 (30,000) (6,365) (5,660) 2009 49,550 14,569 (40,000) (5,941) 18,179 2010 65,322 20,673 (40,000) (5,198) 40,797 2011 82,023 25,311 (40,000) (6,497) 60,837 2012 104,491 28,836 (40,000) (8,122) 85,206 *The depreciation & amortization is estimated at 20% of gross fixed assets, with a 50% inclusion rate in the first year for new additions **Increases in working capital per year are based on turnover of receivables, inventory, and payables equal to 2007 levels Exhibit 5 FEDERAL'S ESTIMATES FOR LULULEMON'S CURRENT SHAREHOLDINGS Dennis (Chip) Wilson Advent International Corporation Highland Capital Partners Employees, directors, other Total shares outstanding pre-IPO Shares owned pre-IPO Number Percentage 36,399,425 49.8% 27,785,536 38.1% 6,994,963 9.6% 1,839,027 2.5% 73,018,951 100.0% Source: Lululemon filings Exhibit 6 VENTURE-BACKED LIQUIDITY EVENTS BY YEAR, 2001-2006 Quarter/ Total M&A M&A *Total Average **Number Total Average Year Deals Deals with Disclosed M&A Deal of IPOs Offer IPO Offer Disclosed M&A Size ($M) Amount Amount Values Value ($M) ($M) ($M) 2001 353 165 16,799 101.8 3,490 85.1 2002 318 152 7,916 52.1 22 2,109 95.9 2003 291 123 7,726 62.8 29 2,023 69.8 2004 339 186 15,441 83 93 11,015 118.4 2005 347 168 16,094 95.8 564,461) 79.7 2006 347 149 16,676 111.9| 57 5,117 89.8 41 1231 461 DATA ON SELECTED COMPARATORS VF Corp Polo Ralph Lauren Hanesbrands 01-Apr 01-Jul $ 3,746,300 $ 4,472,832 $ 82.05 $ 25.58 Lululemon Athletica 31-Jan $ 148,885 $6,138,087 $ 75.87 28.1x 7.6x Nike Year End 31-May Sales, most recent fiscal year ($000s) $ 14,954,900 Closing price, Dec 31st, 2006 $ 98.81 Price earnings ratio (closing) 2006 36.3x 2005 34.9x 2004 48.2x Sales CAGR (2003-2006) 11.8% EBIT margins 2006 14.1% 2005 13.6% 2004 12.0% 30.7% 22.9x NA NA 16.0x 12.1x 12.5x 15.4% -0.9% 6.1% 41.0% 13.8% 9.1% 10.3% 9.7% 7.7% 9.2% 13.3% 12.7% 12.8% 10.9% 4.4% 4.1% 9.3% Net profit margins 2006 2005 2004 8.8% 7.7% 8.2% 5.8% 6.5% 7.2% 4.7% 9.7% 8.6% 7.8% 7.8% 5.1% 1.7% -3.5% Retum on equity 2006 2005 2004 22.1% 21.5% 19.8% 15.0% 11.4% 12.0% 10.0% 8.4% 16.1% 16.3% 18.0% 18.9% 20.5% 5.0% 3.4x Price-to-book value 2006 2005 2004 8.6x 8.1x 10.3x 4.8x 3.6x 2.8% 0.8x NA NA 3.0x 3.2x Interest coverage 2006 2005 2004 106.9x 388.5x 59.0x 41.3x 27.3x 27.4x 16.6x 10.2x 11.4x 14.4x 11.7x 10.2x 342.4x 73.0x -36.8x Book capitalization De bt* Equity Total 7.9% 92.1% 100.0% 24.2% 75.8% 100.0% 2,464 27.9% 72.1% 100.0% 13.8% 86.2% 100.0% 50,591 0.69 6% 94% 100% 8,648 8,511 Total market value of equity ($000s) Beta - weekly, over two years Debt rating (S&P) 1.38 NA 0.96 A+ NR NR A- Exhibit 8 SELECTED MARKET INFORMATION, FEBRUARY 28, 2007 U.S. Treasuries 1 month 3 month 6 month 1 year 2 year 3 year 5 year 7 year 10 year 20 year 30 year Rate 5.24% 5.16% 5.12% 4.96% 4.65% 4.55% 4.52% 4.53% 4.56% 4.78% 4.68% Year 2002 2003 2004 2005 2006 S&P 500 Index Value Dec.31 880 1,112 1,212 1,248 1,418 Price-to Earnings ratio 32.18 22.97 20.26 18.06 18.23 INTRODUCTION It was late March 2007, and Richard McDonald, a managing director at Federal Securities (Federal), was briefing his team on a financing proposal for Lululemon Athletica (Lululemon). Federal Securities was a mid-sized investment bank and in recent years, had managed several capital issues for businesses in the retail sector. McDonald had been monitoring Lululemon's progress over the past few years and had been impressed by the company's unique positioning and its rapid growth. He felt it might be timely to approach the firm with a proposal to raise new funds through an initial public offering (IPO) or a debt issue. McDonald felt there were two significant reasons for pitching Lululemon on a financing proposal. First, raising funds through a stock offering would allow the company's founder, Dennis Wilson, and the two private equity firms, Advent International and Highland Capital Partners, to realize the value they had created by selling some shares. Second, new financing would provide Lululemon with enough cash to carry out its immediate plans to open more stores in the United States and Canada. Lululemon was a rapidly growing designer, manufacturer and retailer of premium-priced yoga athletic wear. In fiscal 2007, eight years after Wilson had started the company, Lululemon earned a net income of $11 million from revenues of $149 million. The U.S. and Canadian Athletic Apparel Market According to the NPD Group, a research firm, the U.S. athletic apparel market was worth $47 billion in 2007, about 10 times the size of the Canadian athletic apparel market.* Although athletic clothing had initially been developed to meet the needs of athletes, changes in consumer tastes had increased the appeal of athletic clothing, in turn attracting a wider audience whose members often insisted on style as well as function. In response to this growing demand, large apparel companies, such as Nike, focused on * This case has been written on the basis of published sources only. Consequently, the interpretation and perspectives designing stylish clothing from technical fabrics that could repel rain, allow perspiration vapour to escape, and wick moisture away from skin. Apparel designs were often developed in the United States and Europe and were usually manufactured in low-cost countries, such as China, Honduras and Vietnam. As new apparel lines were constantly being introduced, advertising stood out as the key to driving sales. Athletic apparel was sold through mass merchandisers, department stores and specialty goods stores. Some brand-name firms, such as Nike, had their own stores. Women purchased more than 80 per cent of athletic apparel, and some of the fastest growing athletic apparel categories involved low-impact group sports and activities such as walking and yoga. Competition in the market was increasing as high-end fashion brands such as Ralph Lauren, Prada and Tommy Hilfiger started to introduce athletic apparel into their lineups. LULULEMON ATHLETICA Chip Wilson had been involved in the apparel industry since 1979, setting up his first Lululemon Athletica store in the trendy Vancouver neighbourhood of Kitsilano. To attract customers, Wilson began his operations by stocking the store with well-known branded apparel, in addition to the newly designed Lululemon products. As customers browsed the store, Wilson sought feedback on Lululemon's first design prototypes. He had located his design studio in the middle of the store so prototypes could be altered on the spot. Wilson built up a small line-up of clothing, producing pieces in small batches in order to minimize risk. The top-selling item was the Lululemon pant, made from form-fitting Lycra. Lululemon offered feminine, high-quality clothing that fit most body types. The target consumer was an early 30s professional woman who was well educated and had significant disposable income. Wilson relied on his contacts in the fabric industry to procure fabrics for his active wear. To further differentiate Lululemon's products, Wilson developed proprietary fabrics such as Silverescent, Vitasea, and Luon. Silverescent incorporated silver particles because of its anti-bacterial properties. Vitasea was a fabric developed from a seaweed compound. According to Lululemon, it released amino acids, minerals and vitamins directly into the skin. Luon was a fabric that wicked away moisture, was flexible and was designed to reduce irritation." The design process included gathering extensive customer feedback through the use of focus groups and in-store surveys. Lululemon maintained a research-and-development room at its headquarters, where hundreds of potential product designs were stored. Clothing destined for North American stores was manufactured in two independent facilities in Vancouver in which Lululemon had a minority equity stake. Having a design facility, stores and a manufacturing facility located near headquarters meant that Lululemon could make last-minute changes to product designs and alterations to production levels, depending on sales volume. To reduce shipment time and product costs, clothing destined for Asia-Pacific stores was produced in China by Lululemon's Vancouver manufacturing partners. Clothing designs were manufactured in small batches about 1,000 pieces per batch and inventories at the store level were checked and replenished every 45 days. There was a testing period when new products were launched. If products sold well, they were added to the regular lineup. Lululemon's success allowed Wilson to add stores across Canada, the United States, Australia and Japan. By 2007, the company operated 59 retail stores in total. Seven of these stores were owned by franchisees (see Exhibit 1). Lululemon garments were also made available at wholesale prices to retailers in non- competing territories. Stores were typically 2,500 square feet in size and located near other high-end retailers that were targeting the same customer group. For example, Lululemon stores could be found on main shopping streets, in higher-end malls next to retailers such as Banana Republic, The Gap, and even Gucci and other specialty retailers such as organic food markets. Lululemon employed 650 part-time and full-time workers in its stores. Employees were hired based on their customer service orientation and attitude. Retail floor employees were called "educators," and their goals were to greet customers with a smile, provide cheerful advice and educate the consumer on the technical aspects of each garment. These educators were even encouraged to tell guests when a garment they were trying on did not fit the way it was designed to or when it was unflattering to the customer. Lululemon paid its retail employees an hourly wage 30 per cent higher than the minimum wage offered by most retailers. Management was encouraged to deal with staff on a transparent basis and incorporate employee input wherever possible. Lululemon's part-time employee turnover was about 20 per cent per year, considerably lower than the retail industry average of over 50 per cent. To promote its stores and products, Lululemon relied on word-of-mouth advertising and on local endorsements. Each store appointed a "community educator" who recruited about six brand ambassadors for the store. Ambassadors were selected based on their level of connection and prominence in the local athletic community; they were given free clothing to wear, but they did not have any formal requirement to promote the brand. In stores, photographs featuring these local ambassadors were prominently displayed. In addition, Lululemon held selected events to draw crowds to its stores. For example, in Vancouver, Lululemon gave away free clothing to the first few people who showed up naked at a new store opening. Due to its growing popularity, Lululemon's products were a favourite topic for local and national media outlets, garnering free publicity for the firm. The company typically spent one per cent of sales on marketing Competitors Lululemon capitalized on its first-mover advantage to expand rapidly. The company had been uniquely positioned in the market before its success caught the attention of Canadian retailers. Several competitors started to augment their product line with look-alike clothing. For example, retailers like Aritzia and Roots - both Canadian firms added yoga-inspired clothing that was loosely based on Lululemon's designs. Aritzia was based in Vancouver and had 55 stores mainly in Canada (with six stores in the United States). Aritzia's yoga apparel, which was developed to augment its product line-up, seemed to copy style elements from Lululemon's collection. As a Canadian retailer that sold outdoor-style clothing such as sweatshirts, cargo pants and jackets, Roots had 120 stores in Canada, the United States and Asia. It too had recently added a small section of yoga-inspired clothing. Lululemon also competed against several other, smaller, yoga-clothing retailers, such as Kharma Athletics, Lotuswear and Tonic. Kharma Athletics started up in 2002 in Vancouver as a manufacturer of yoga clothing that was fashionable and colourful. Lotuswear was founded in 2004 and differentiated its brand from those of its competitors by promoting a particular focus on environmental and social consciousness. Tonic was founded in 2004 and created fashionable yoga clothing. None of these competitors could match Lululemon's record for growth or its expansive network of nearly 60 stores. However, serious competition could come from large companies such as Nike, Polo Ralph Lauren, Hanesbrands or VF Corp. Nike was the global leader in athletic shoes and apparel, with a market capitalization of $51 billion and 675 company-owned stores. It designed, developed and marketed footwear, apparel, equipment and accessory products and used proprietary fabrics such as Dri-FIT, that were designed to be cool, breathable and moisture-wicking. Nike designed women's athletic apparel for a range of sports and had just launched a line of yoga-specific items. Nike promoted its products by sponsoring sporting events and focusing on key athletes, as well as using extensive advertising; for example, in 2006, the company spent $678 million on advertising in the U.S. market. Its promotional efforts included sponsoring events and key athletes. Polo Ralph Lauren was a designer and distributor of lifestyle branded apparel. It designed and sold products to retailers through about 1,950 upscale department stores and through its own network of 282 specialty stores. The company enjoyed strong brand equity for its higher-end apparel and boasted nearly a million customers on its e-commerce website, polo.com. Hanesbrands was a clothing company that was spun off by the Sara Lee Corporation in September 2006. With $431 million in annual sales, its flagship Hanes brand produced, among other things, active wear such as performance T-shirts and shorts, and casual wear such as T-shirts, fleece and sports shirts. Its second largest brand, Champion, was well-known as an urban fashion brand. The brand had a history of innovation, inventing the sports bra and reversible t- shirts. VF Corp. had more than $6 billion in revenues in 2006 and was the world's largest apparel company. It had a stable of brands targeted at younger consumers including North Face, Vans, JanSport, Wrangler, Lee, Nautica and other brands. While it seemed as if many clothing retailers were adding similar form-fitting, Lycra-based clothing, McDonald felt that Lululemon continued to enjoy the top spot in terms of brand image. He did not feel that increased competition was a major threat since Lululemon continued to be innovative by launching new products and updating its lineup frequently. Financial Performance Exhibits 2 and 3 show Lululemon's recent historical financial statements. The company had financed its expansion largely through new equity investments and internal funds. Its capital needs remained low as a result of renting (rather than owning) stores and carefully managing inventory levels. Customers made their purchases with guaranteed funds (i.e., cash or debit cards or credit cards), and suppliers were paid within 30 to 45 days. At the end of fiscal 2007, Lululemon had little debt outstanding other than capitalized leases. The interest expense reported on the income statement indicated the company has used debt financing during the year; however, no debt was outstanding at the end of the fiscal year. REALIZING VALUE AND SECURING CASH FOR FUTURE GROWTH Key Shareholders In December 2005, Wilson sold 48 per cent of Lululemon to Advent International (Advent) and Highland Capital Partners (HCP) for a total of $93 million. He took a step back from active management, appointing former Reebok chief executive officer (CEO) and Advent operating partner Robert Meers as CEO of Lululemon. At Reebok, over a period of 15 years, Meers had grown sales from $13 million to $3.5 billion. Wilson now owned 49.8 per cent of the firm, with another 2.5 per cent owned by Lululemon employees and directors. In media articles, Lululemon management had indicated that it would open 25 more stores in 2007 and another 30 to 35 stores in 2008. This increase in the store network would drive sales as well as capital expenditures. McDonald estimated that as the company added stores, it would become more efficient with its capital budget for each new store: store designs could be repeated, Lululemon's brand could drive better lease terms, and leasehold improvements could be purchased in bulk. In spite of the fact that Lululemon stated it was expecting high sales growth in its current stores, the company did not provide any details of its growth plans beyond the next two years. However, McDonald and his team began building a financial forecast based on their own estimates and on conversations with industry observers and research analysts (see Exhibit 4). From fiscal year 2010 to fiscal year 2012, an annual growth of 25 per cent would translate into an addition of between 35 and 47 stores per year. As each store established itself within the community, its revenues would continue to rise as the customer base grew and the merchandise mix was optimized to match local needs. Hence, the rapidly expanding company would have, for the next few years, a portfolio consisting of new stores and maturing stores. New-store sales were generally lower than sales from mature stores i.e., stores that had been established for three years or longer). For forecasting purposes, the average sales per store within the company's entire portfolio of new and mature stores were estimated to be about $3 million per year. Lululemon's cost of goods sold could be lowered to about 45 per cent, as efficiencies were reaped in manufacturing and in the negotiation of leases. By 2009, cost savings from higher volumes would be partly offset by additional costs such as insurance and storage. The Federal team estimated that Lululemon could reduce its selling and administration expenses down to about 30 per cent a year by 2010, as its sales volumes grew faster than its supporting sales and administrative infrastructure. Capital expenditures were expected to grow in tandem with Lululemon's store network. However, new store costs were expected to benefit from increased purchasing power for industrial supplies, driving down the costs involved in leasehold improvements per store. Federal estimated that capital expenditures for new stores, current stores and corporate improvements would average $40 million a year for 2009 and beyond. Lululemon's tax rate had been very high in the last two years due to unusual tax items and Federal expected the company's tax rate would approach normal levels of 30 per cent in the future. Risks In spite of the optimistic forecast, there were a variety of risks to consider. Lululemon intended to expand primarily in the highly competitive U.S. market. The consumer had many choices for active wear or sportswear, and competitors had been keeping an eye on Lululemon for the past few years. Lululemon expected to gain market share as it opened up new stores, but there were risks that revenue growth could slow if competitors managed to gain traction with their own active wear brands. In addition, while yoga was growing in popularity, another sport or activity could emerge to displace it, potentially drawing away consumers. Federal estimated that, in a pessimistic scenario, Lululemon's growth rate could slow to 20 per cent per year, with a corresponding decrease in its store footprint growth rate. The cost of leases was rising along with the price of real estate. In addition, Lululemon had to rapidly hire new employees and implement new systems to manage the increased flow of goods. The company would likely incur much higher store-operating expenses as a result, which could more than offset gains in In media articles, Lululemon management had indicated that it would open 25 more stores in 2007 and another 30 to 35 stores in 2008. This increase in the store network would drive sales as well as capital expenditures. McDonald estimated that as the company added stores, it would become more efficient with its capital budget for each new store: store designs could be repeated, Lululemon's brand could drive better lease terms, and leasehold improvements could be purchased in bulk. In spite of the fact that Lululemon stated it was expecting high sales growth in its current stores, the company did not provide any details of its growth plans beyond the next two years. However, McDonald and his team began building a financial forecast based on their own estimates and on conversations with industry observers and research analysts (see Exhibit 4). From fiscal year 2010 to fiscal year 2012, an annual growth of 25 per cent would translate into an addition of between 35 and 47 stores per year. As each store established itself within the community, its revenues would continue to rise as the customer base grew and the merchandise mix was optimized to match local needs. Hence, the rapidly expanding company would have, for the next few years, a portfolio consisting of new stores and maturing stores. New-store sales were generally lower than sales from mature stores i.e., stores that had been established for three years or longer). For forecasting purposes, the average sales per store within the company's entire portfolio of new and mature stores were estimated to be about $3 million per year. Lululemon's cost of goods sold could be lowered to about 45 per cent, as efficiencies were reaped in manufacturing and in the negotiation of leases. By 2009, cost savings from higher volumes would be partly offset by additional costs such as insurance and storage. The Federal team estimated that Lululemon could reduce its selling and administration expenses down to about 30 per cent a year by 2010, as its sales volumes grew faster than its supporting sales and administrative infrastructure. Capital expenditures were expected to grow in tandem with Lululemon's store network. However, new store costs were expected to benefit from increased purchasing power for industrial supplies, driving down the costs involved in leasehold improvements per store. Federal estimated that capital expenditures for new stores, current stores and corporate improvements would average $40 million a year for 2009 and beyond. Lululemon's tax rate had been very high in the last two years due to unusual tax items and Federal expected the company's tax rate would approach normal levels of 30 per cent in the future. Risks In spite of the optimistic forecast, there were a variety of risks to consider. Lululemon intended to expand primarily in the highly competitive U.S. market. The consumer had many choices for active wear or sportswear, and competitors had been keeping an eye on Lululemon for the past few years. Lululemon expected to gain market share as it opened up new stores, but t