Answered step by step
Verified Expert Solution
Link Copied!

Question

1 Approved Answer

It can be conjectured that the annual rate of return of a security and the market rate of return return are related by the following

  1. It can be conjectured that the annual rate of return of a security and the market rate of return return are related by the following regression model

y = mx + b +

Where y is the annual rate of return of the security, x is the annual rate of return of the market, b is the intercept, is the normally distributed noise, and

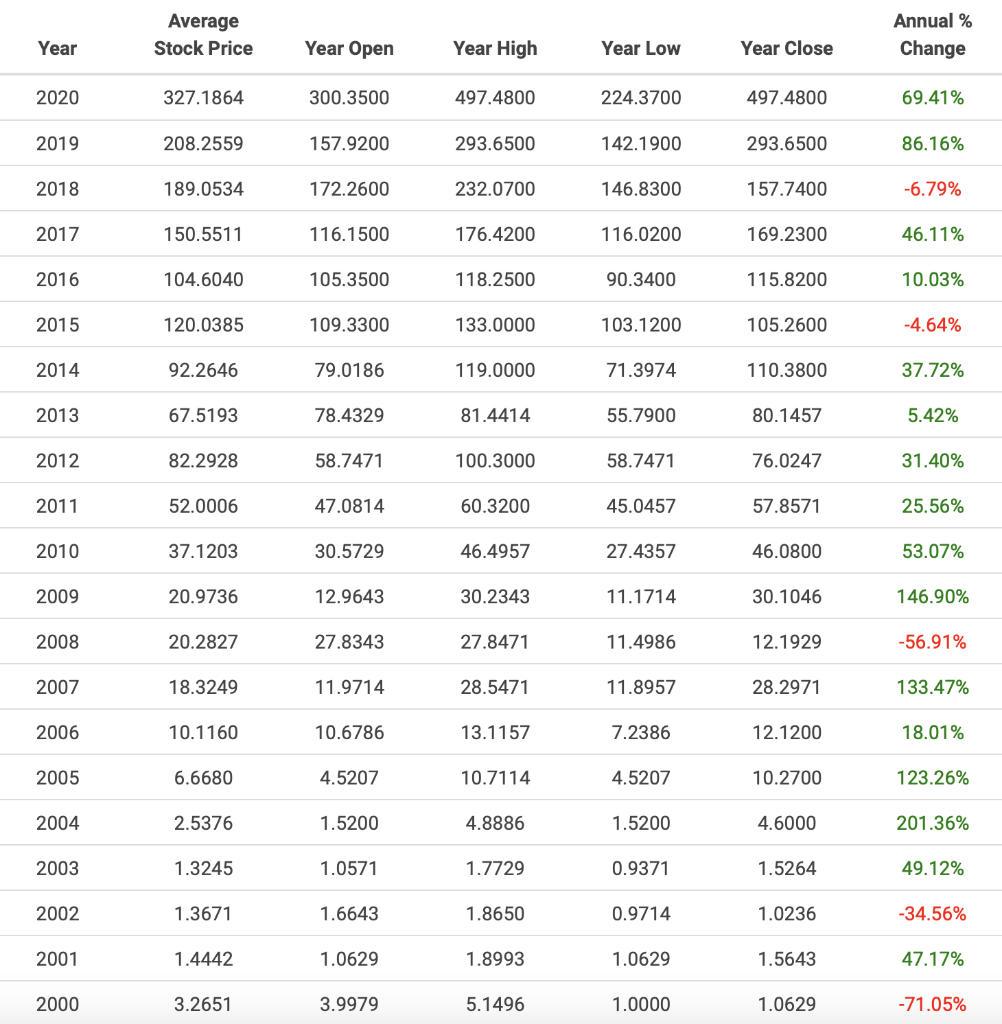
Rate of return = (value at end of the year + received dividends during the year - value at the beginning of the year)/(initial value)

Test this model by retrieving annual data on a security of your choice. Choose a financial index such as S&P 500 as the indicator of the market, and retrieve the data. Use the most recent 20 years as the time span of the data. Perform regression analysis and make sure to include the hypothesis in your study. Provide your results and write your conclusions. Include all relevant information and conclusions, significances, the final regression model, coefficient of determination, graph of the regression line accompanied in the scatterplot, extent of residuals, and normality of residuals. Does the model seem to be valid according to your study? If so, is the influence positive or adverse? If you conclude influence, then your regression model indicates outperformance or underperformance of the market? Explain all your work in detail.

** it can be any security and the S&P 500 index historical data can be found on yahoo finance.

image text in transcribed

Average Stock Price Annual % Change Year Year Open Year High Year Low Year Close 2020 327.1864 300.3500 497.4800 224.3700 497.4800 69.41% 2019 208.2559 157.9200 293.6500 142.1900 293.6500 86.16% 2018 189.0534 172.2600 232.0700 146.8300 157.7400 -6.79% 2017 150.5511 116.1500 176.4200 116.0200 169.2300 46.11% 2016 104.6040 105.3500 118.2500 90.3400 115.8200 10.03% 2015 120.0385 109.3300 133.0000 103.1200 105.2600 -4.64% 2014 92.2646 79.0186 119.0000 71.3974 110.3800 37.72% 2013 67.5193 78.4329 81.4414 55.7900 80.1457 5.42% 2012 82.2928 58.7471 100.3000 58.7471 76.0247 31.40% 2011 52.0006 47.0814 60.3200 45.0457 57.8571 25.56% 2010 37.1203 30.5729 46.4957 27.4357 46.0800 53.07% 2009 20.9736 12.9643 30.2343 11.1714 30.1046 146.90% 2008 20.2827 27.8343 27.8471 11.4986 12.1929 -56.91% 2007 18.3249 11.9714 28.5471 11.8957 28.2971 133.47% 2006 10.1160 10.6786 13.1157 7.2386 12.1200 18.01% 2005 6.6680 4.5207 10.7114 4.5207 10.2700 123.26% 2004 2.5376 1.5200 4.8886 1.5200 4.6000 201.36% 2003 1.3245 1.0571 1.7729 0.9371 1.5264 49.12% 2002 1.3671 1.6643 1.8650 0.9714 1.0236 -34.56% 2001 1.4442 1.0629 1.8993 1.0629 1.5643 47.17% 2000 3.2651 3.9979 5.1496 1.0000 1.0629 -71.05% Average Stock Price Annual % Change Year Year Open Year High Year Low Year Close 2020 327.1864 300.3500 497.4800 224.3700 497.4800 69.41% 2019 208.2559 157.9200 293.6500 142.1900 293.6500 86.16% 2018 189.0534 172.2600 232.0700 146.8300 157.7400 -6.79% 2017 150.5511 116.1500 176.4200 116.0200 169.2300 46.11% 2016 104.6040 105.3500 118.2500 90.3400 115.8200 10.03% 2015 120.0385 109.3300 133.0000 103.1200 105.2600 -4.64% 2014 92.2646 79.0186 119.0000 71.3974 110.3800 37.72% 2013 67.5193 78.4329 81.4414 55.7900 80.1457 5.42% 2012 82.2928 58.7471 100.3000 58.7471 76.0247 31.40% 2011 52.0006 47.0814 60.3200 45.0457 57.8571 25.56% 2010 37.1203 30.5729 46.4957 27.4357 46.0800 53.07% 2009 20.9736 12.9643 30.2343 11.1714 30.1046 146.90% 2008 20.2827 27.8343 27.8471 11.4986 12.1929 -56.91% 2007 18.3249 11.9714 28.5471 11.8957 28.2971 133.47% 2006 10.1160 10.6786 13.1157 7.2386 12.1200 18.01% 2005 6.6680 4.5207 10.7114 4.5207 10.2700 123.26% 2004 2.5376 1.5200 4.8886 1.5200 4.6000 201.36% 2003 1.3245 1.0571 1.7729 0.9371 1.5264 49.12% 2002 1.3671 1.6643 1.8650 0.9714 1.0236 -34.56% 2001 1.4442 1.0629 1.8993 1.0629 1.5643 47.17% 2000 3.2651 3.9979 5.1496 1.0000 1.0629 -71.05%

Step by Step Solution

There are 3 Steps involved in it

Step: 1

blur-text-image

Get Instant Access to Expert-Tailored Solutions

See step-by-step solutions with expert insights and AI powered tools for academic success

Step: 2

blur-text-image

Step: 3

blur-text-image

Ace Your Homework with AI

Get the answers you need in no time with our AI-driven, step-by-step assistance

Get Started

Recommended Textbook for

The Commercial Real Estate Investors Handbook

Authors: Steven D. Fisher

1st Edition

1601380372, 978-1601380371

More Books

Students also viewed these Finance questions