Answered step by step
Verified Expert Solution
Question
1 Approved Answer
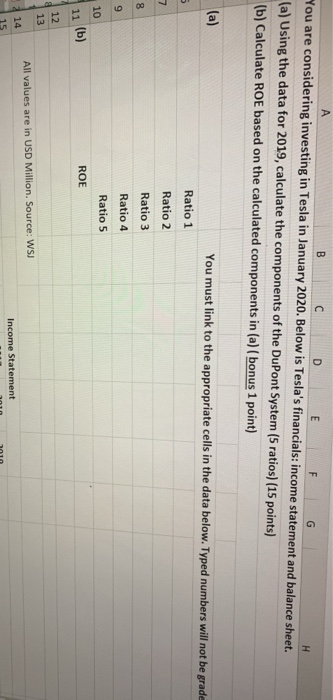
it is there B C D E F G You are considering investing in Tesla in January 2020. Below is Tesla's financials: income statement and
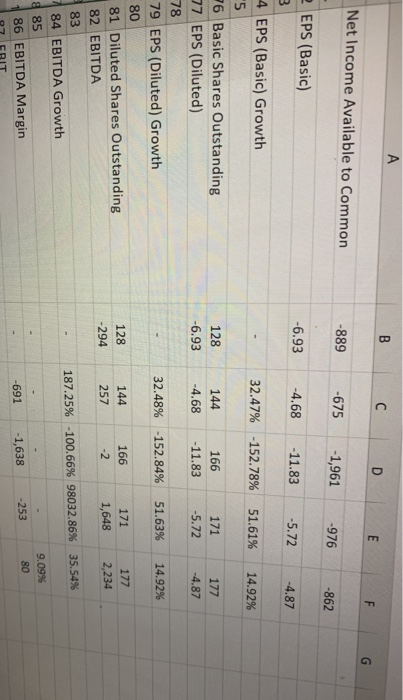
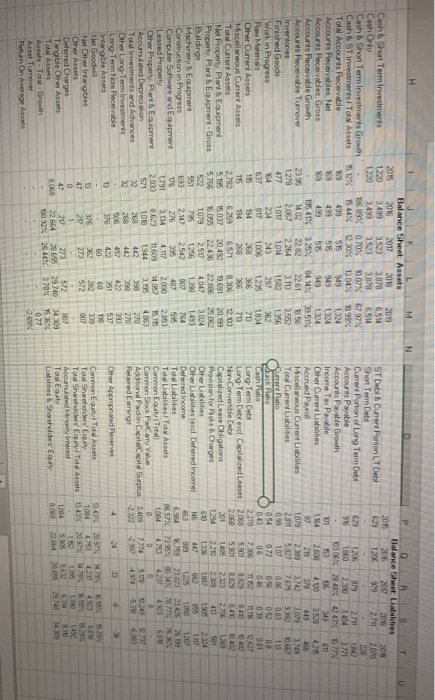
it is there
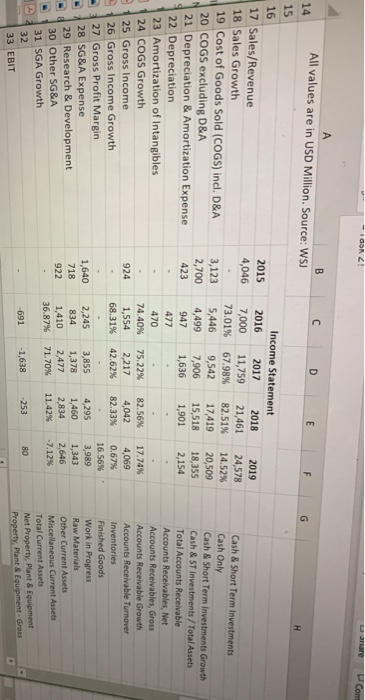
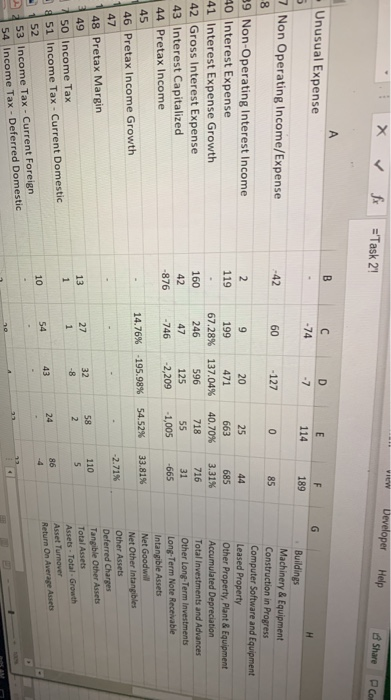
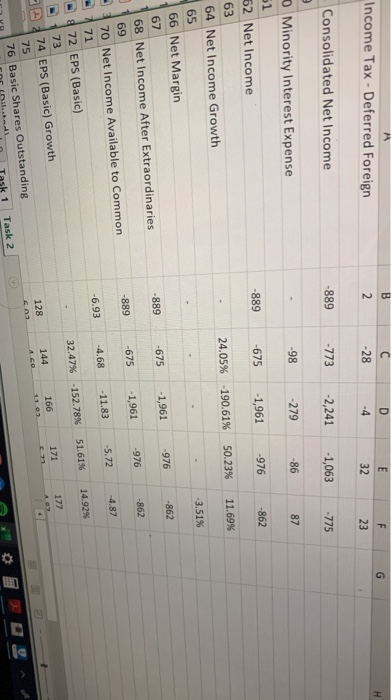
B C D E F G You are considering investing in Tesla in January 2020. Below is Tesla's financials: income statement and balance sheet. (a) Using the data for 2019, calculate the components of the DuPont System (5 ratios) (15 points) (b) Calculate ROE based on the calculated components in (a) (bonus 1 point) (a) You must link to the appropriate cells in the data below. Typed numbers will not be grade Ratio 1 Ratio 2 Ratio 3 Ratio 4 Ratio 5 ROE All values are in USD Million. Source: WSJ Income Statement GOZ! anare Com 14 All values are in USD Million. Source: WSJ 15 16 2015 17 Sales/Revenue 4,046 18 Sales Growth 19 Cost of Goods Sold (COGS) incl. D&A 3,123 20 COGS excluding D&A 2,700 21 Depreciation & Amortization Expense 423 22 Depreciation 123 Amortization of Intangibles J 124 COGS Growth 25 Gross Income 924 26 Gross Income Growth 27 Gross Profit Margin 1,640 28 SG&A Expense 718 29 Research & Development 30 Other SG&A 31 SGA Growth Income Statement 2016 2017 2018 7,000 11,759 21,461 73.01% 67.98% 82.51% 5,446 9,542 17,419 4,499 7,906 15,518 947 1,636 1,901 477 470 74.40% 75.22% 82.56% 1,554 2,217 4,042 68.31% 42.62% 82.33% 2019 24,578 14.52% 20,509 18,355 2,154 17.74% 4,069 0.67% 16.56% 3,989 1,343 2,646 -7.12% Cash & Short Term Investments Cash Only Cash & Short Term Investments Growth Cash & ST Investments/Total Assets Total Accounts Receivable Accounts Receivables, Net Accounts Receivables, Gross Accounts Receivable Growth Accounts Receivable Turnover Inventories Finished Goods Work in Progress Raw Materials Other Current Assets Miscellaneous Current Assets Total Current Assets Net Property, Plant & Equipment Property Plant & Equipment Gross 2,245 834 1,410 36.87% 3,855 1,378 2,477 71.70% 4,295 1,460 2,834 11.42% 922 -691 1,638 - 253 80 33 EBIT W D X Developer f ='Task 2! Help Share PCom Unusual Expense 7 Non Operating Income/Expense -42 60 1270 85 20 199 67.28% 25 44 471 663 685 137.04% 40.70% 3.31% 596 718 716 125 55 31 -2,2091,005665 160 246 47 -746 Buildings Machinery & Equipment Construction in Progress Computer Software and Equipment Leased Property Other Property, Plant & Equipment Accumulated Depreciation Total Investments and Advances Other Long-Term Investments Long-Term Note Receivable Intangible Assets Net Goodwill Net Other Intangibles Other Assets Deferred Charges Tangible Other Assets Total Assets Assets - Total Growth Asset Turnover Return On Average Assets 39 Non-Operating Interest Income 10 Interest Expense 41 Interest Expense Growth 42 Gross Interest Expense 43 Interest Capitalized 44 Pretax Income 45 46 Pretax Income Growth 47 148 Pretax Margin 49 750 Income Tax 51 Income Tax - Current Domestic 52 -876 14.76% -195.98% 54.52% 33,81% -2.71% 53 Income Tax - Current Foreign 54 Income Tax - Deferred Domestic Income Tax - Deferred Foreign Consolidated Net Income -889 -773 -2,241 -1,063 O Minority Interest Expense -98 - 279 -86 51 -889 -675 -1,961 -976 -862 24.05% -190.61% 50.23% 11.69% 52 Net Income 63 64 Net Income Growth 65 66 Net Margin 67 68 Net Income After Extraordinaries -3.51% -862 -976 -889 -675 -1,961 -862 -675 -1,961 976 -889 -4.87 70 Net Income Available to Common -5.72 - 11.83 -6.93 -4.68 71 51.61% 14.92% 72 EPS (Basic) 32.47% -152.78% 73 171 177 74 EPS (Basic) Growth 128 144 166 76 Basic Shares Outstanding riko Task 1 Task 2 Net Income Available to Common D EPS (Basic) -889 E -675 F -1,961 -976 4 EPS (Basic) Growth -6.93 -862 -4.68 -11.83 -5.72 -4.87 32.47% '6 Basic Shares Outstanding 77 EPS (Diluted) -152.78% 51.61% 14.92% 128 -6.93 I 144 166 -4.68 -11.83 171 -5.72 177 14.87 32.48% -152.84% 51.63% 14.92% 78 79 EPS (Diluted) Growth 80 81 Diluted Shares Outstanding 82 EBITDA 83 84 EBITDA Growth 85 86 EBITDA Margin COIT 128 -294 144 257 166 171 1,648 177 2,234 187.25% -100.66% 98032.86% 35.54% 9.09% -691 1,638 -253 80 Balance Sheet Assets 2015 2016 2017 2018 2019 1220 3.499 3523 3878 6.54 1.220 3.499 3 ,523 3,870 6, 514 106 89% 070% 0.07% 67 97% 15.12% 15.44% 30% 1304% 98% 163493515 949 1324 169 499 515 949 1 324 169 4 93 55 949 1324 - 135 41% 3.25% 84 % 39.517 23.95 1402 2 282 2261 156 1.278 2,067 2 .264 3.113 3.552 477 101 1014 1582 1356 54 234 2 43 297 362 637 817 1006 1235 1834 115 34 268 356 713 258 386 713 2,782 6.571 806 2.02 5.195 20.452 13691 20.199 5.766 25,062 1079 2.517 4.047 3.024 1256 1201493 2.542 807 764 Halance Sheet Liabilities 2016 2017 2018 2019 ST Debt Current Portion LT Debt 1206 319 271 2070 Short Term Debt Current Portion of Long Term Debe 12069792711 1842 Accounts Payable 1860 2030 204 3771 Accounts Payable Growth 103.06% 2848% 42.433 077% Income Tax Payable 201 3 136 349 611 Other Current Labbes 1154 2.600 4.20 352 426 Accrued Payroll 87 219 378 449 456 Miscellaneous Curry Liabilities 289 3742 303 3.749 TO Current Liabilities 2811 5.027 7675 990 0.667 no 0991070.86 0.8311 Stick Palio 054 072056 05208 Cash aho 043 06 015 039 061 Long-Term Debt 222207386 526 27 Long Term Debt excl. Capitalized Leases 5.801 8.23 8.410 402 Non-Corwertible Debt 2068 5.901B 840 0402 201 Capitalized Lease Obligations 1485 2103 1239 2706 Provision for asks & Charges 1.294 22102 309 413 581 60 1905 1206 Other Liabilities 2234 146 Other Lisbites exclDeferred Income 447 662 1117 5 Deferred Income 463 889 1 225 1050 1207 To Liabilities 6,984 5.759 230 23,426 26198 TobiesTotal Asses 06 57% 73.96% 80 % 78 77 76265 Common Equity Total 1064 47534217 403 6618 Common Stock Parcary Value Additional Padin Capital Surplus 3.4097,774 91780.20 0.737 Petardarrings -2.2 2.987 4974 538 6080 115 Cash & Short Term Investments Cash Only Cash & Short Term Inwestments Growth Cash & ST Investments/Total Assets Total Accounts Receivable Accounts Receivables Net Accounts Peceivables, Gross Accounts Receivable Growth Accounts Receivable Turnover inweritories Finished Goods Work in Progress How Materials Other Current Assets Miscellaneous Current Assets Total Current Assets Net Property. Plant Equpment Property. Plant Equipment Gross Buildings Machinery Equipment Construction in Progress Computer Software and Equipment Leased Property Other Property. Plant & Equipment Accurred Depreciation Total Investments and Advances Other Long Term Investments Long-Term Not Receivable Irlangble Assets Net Goodwill Net Other Intangibles Other Assets Deferred Charges Tongble Other Assets Total Assets Asses - Total Growth Asset Turnover Return On Average Assets 2060 5037 2.147 2.030 2.853 3,134 8.623 4.117 11609 2030 1944 930 . Other Appropriated Reserves . 5518 OV Common Equity Total Assets To Shareholders' Equy 10044753 427 To Shareholders' Equity To Asses43% 20 1 7 Accumulated Minolynes Total Equal 10 5.9055670 Liabilities & Shareholders' Eu 807 .314 RU 8,058 22 664 1809296 28.655 26.44% 29740 378% 35% 077 2.60 Step by Step Solution
There are 3 Steps involved in it
Step: 1

Get Instant Access to Expert-Tailored Solutions
See step-by-step solutions with expert insights and AI powered tools for academic success
Step: 2

Step: 3

Ace Your Homework with AI
Get the answers you need in no time with our AI-driven, step-by-step assistance
Get Started


