

Question
its asking to fill in the chart (table 2) by using (table 1). 1. Complete the table 2: figure out the ROE, profit margin, asset
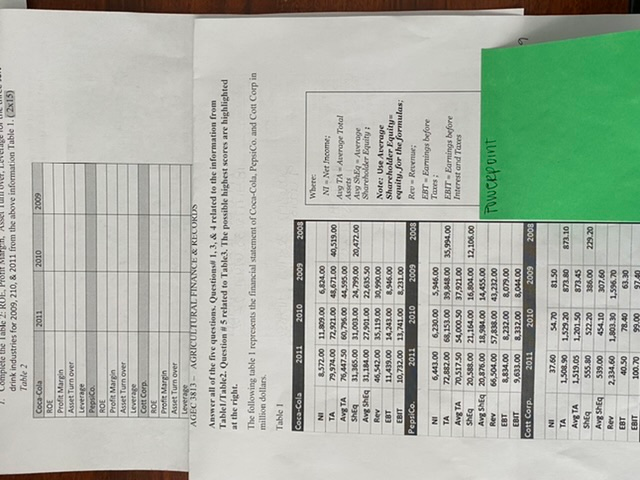
its asking to fill in the chart (table 2) by using (table 1).
1. Complete the table 2: figure out the ROE, profit margin, asset turn over and leverage for the three soft drink industries for each year (2011,2010,2009)
1. Complete the Table RUE, Pront Marn, ASSEL TUTUST. LUCIU WILL drink industries for 2009, 210, & 2011 from the above information Table 1. (2x15) Table 2 Coca Cola 2010 2009 ROE Profit Margin Asset Turn over Leverage PepsiCo. ROE Profit Margin Asset Turn over Cott Corp. ROE Profit Margin Asset Turn over Leverage AGEC 3813 - AGRICULTURAL FINANCE & RECORDS Anywer all of the five questions. Questions 1.3.& 4 related to the information from Table/Table2. Questions related to Table3. The possible highest scores are highlighted at the right. The following table i represents the financial statement of Coca-Cola, PepsiCo, and Cott Corp in million dollars Table 1 Coca-Cola 2011 2010 2009 2008 Where 40,519.00 20,472.00 NI TA Avg TA ShEq Avg Sh Rev EBT EBIT PepsiCo 8,572.00 79,974.00 76,447.50 31,165.00 31,184.00 46,542.00 11439.00 10.732.00 2011 11.809.00 72,921,00 60,7%5.00 31,003.00 27,901.00 35,119.00 14,243.00 11,741.00 2010 6,824.00 48,671.00 44,595.00 24,799.00 22,635.50 30,990.00 8.946.00 8.231.00 2009 NI - Net Income: Aug TA - Average Total Assets Ang SHEQ - Auvrage Shareholder Equity Note: Use Average Shareholder Equity equity for the formulas; Re-Reen; EBT - Earnings before Taxes: EBIT - Earnings before Interest and Taxes 2003 35.994.00 12,105.00 NI TA Avg TA ShE9 Avg Sh Rev EBT EBIT Cote Corp 6,443,00 72.882.00 70,517.50 2 0,588.00 20,876.00 66,504.00 8,834.00 9,633.00 2011 6,230.00 68.153.00 $4,000.50 21,164.00 18,984.00 57,838.00 8,232.00 132.00 2010 5,946.00 39.38.00 37,921.00 16,801,00 14.455.00 43,232.00 8,079.00 8.044.00 2009 Towcepoint Ave TA SMEG Avg She 37.60 1,508.50 1,519.05 555.80 539.00 2,334.60 40.50 100.70 $4.70 1.523.20 1,201.50 522.20 454.10 1.803.30 78.40 99.00 31.50 873.80 873.45 385.00 307.60 1,596.70Step by Step Solution
There are 3 Steps involved in it
Step: 1

Get Instant Access to Expert-Tailored Solutions
See step-by-step solutions with expert insights and AI powered tools for academic success
Step: 2

Step: 3
Ace Your Homework with AI
Get the answers you need in no time with our AI-driven, step-by-step assistance
Get Started
Are You Ready For An ISMS Audit Based On 27001
Authors: BSI British
1st Edition
0580829138, 978-0580829130