

Question: Its Visual Basic SC 101-Intro to Computer Science Spring 2019 Complete the following exercises. Create a folder of your own and use it to store
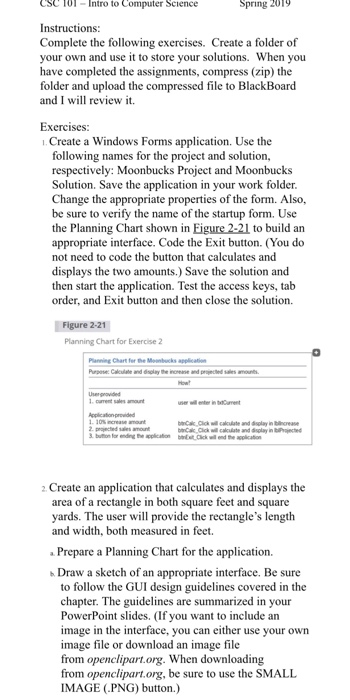
SC 101-Intro to Computer Science Spring 2019 Complete the following exercises. Create a folder of your own and use it to store your solutions. When you have completed the assignments, compress (zip) the folder and upload the compressed file to BlackBoard and I will review it Exercises: . Create a Windows Forms application. Use the following names for the project and solution, respectively: Moonbucks Project and Moonbucks Solution. Save the application in your work folder. Change the appropriate properties of the form. Also, be sure to verify the name of the startup form. Use the Planning Chart shown in Eigure 2-21 to build an appropriate interface. Code the Exit button. (You do not need to code the button that calculates and displays the two amounts.) Save the solution and then start the application. Test the access keys, tab order, and Exit button and then close the solution. Figure 2-21 Planning Chart for Exercise 2 calculate and dsplay in bncrease prajncted sales amount 2 Create an application that calculates and displays the area of a recta yards. The user will provide the rectangle's length and width, both measured in feet Prepare a Planning Chart for the application. Draw a sketch of an appropriate interface. Be sure ngle in both square feet and square to follow the GUI design guidelines chapter. The guidelines are summarized in your PowerPoint slides. (If you want to include an image in the interface, you can either use your own image file or download an image file from openclipart.org. When downloading from openclipart.org, be sure to use the SMALL IMAGE (PNG) button.) covered in the c Create a Windows Forms application. Use the following names for the project and solution, respectively: Area Project and Area Solution. Save the application in your work folder. Change the appropriate properties of the form. Also, be sure to verify the name of the startup form. d Use your Planning Chart as a guide when building the interface e Code the Exit button. (You do not need to code the button that performs the two calculations and displays the results.) Save the solution and then start the application. Test the access keys, tab order, and Exit button and then close the solution. Create an application that calculates and displays the percentage of the total sales made by each of the following three salespeople: Jim, Karen, and Martin. Before creating your Planning Chart, consider what information the user (in this case, the sales manager) will need to enter a. Prepare a Planning Chart for the application. b. Draw a sketc h of an appropriate interface. Include a picture box in the interface. Be sure to follow the GUI de chapter. The guidelines are summarized in Figure 2-20. (You can either use your own image file or download an image file from openclipart.org. When downloading from openclipart.org, be sure to use the SMALL IMAGE (PNG) button.) sign guidelines covered in the c. Create a Windows Forms application. Use the following names for the project and solution, respectively: Sales Project and Sales Solution. Save the application in your work folder. d. Build the interface and then code the Exit button. (You do not need to code the button that calculates and displays the percentages.) e. Save the solution and then start the application. Test the access keys, tab order, and Exit button and then close the solution. SC 101-Intro to Computer Science Spring 2019 Complete the following exercises. Create a folder of your own and use it to store your solutions. When you have completed the assignments, compress (zip) the folder and upload the compressed file to BlackBoard and I will review it Exercises: . Create a Windows Forms application. Use the following names for the project and solution, respectively: Moonbucks Project and Moonbucks Solution. Save the application in your work folder. Change the appropriate properties of the form. Also, be sure to verify the name of the startup form. Use the Planning Chart shown in Eigure 2-21 to build an appropriate interface. Code the Exit button. (You do not need to code the button that calculates and displays the two amounts.) Save the solution and then start the application. Test the access keys, tab order, and Exit button and then close the solution. Figure 2-21 Planning Chart for Exercise 2 calculate and dsplay in bncrease prajncted sales amount 2 Create an application that calculates and displays the area of a recta yards. The user will provide the rectangle's length and width, both measured in feet Prepare a Planning Chart for the application. Draw a sketch of an appropriate interface. Be sure ngle in both square feet and square to follow the GUI design guidelines chapter. The guidelines are summarized in your PowerPoint slides. (If you want to include an image in the interface, you can either use your own image file or download an image file from openclipart.org. When downloading from openclipart.org, be sure to use the SMALL IMAGE (PNG) button.) covered in the c Create a Windows Forms application. Use the following names for the project and solution, respectively: Area Project and Area Solution. Save the application in your work folder. Change the appropriate properties of the form. Also, be sure to verify the name of the startup form. d Use your Planning Chart as a guide when building the interface e Code the Exit button. (You do not need to code the button that performs the two calculations and displays the results.) Save the solution and then start the application. Test the access keys, tab order, and Exit button and then close the solution. Create an application that calculates and displays the percentage of the total sales made by each of the following three salespeople: Jim, Karen, and Martin. Before creating your Planning Chart, consider what information the user (in this case, the sales manager) will need to enter a. Prepare a Planning Chart for the application. b. Draw a sketc h of an appropriate interface. Include a picture box in the interface. Be sure to follow the GUI de chapter. The guidelines are summarized in Figure 2-20. (You can either use your own image file or download an image file from openclipart.org. When downloading from openclipart.org, be sure to use the SMALL IMAGE (PNG) button.) sign guidelines covered in the c. Create a Windows Forms application. Use the following names for the project and solution, respectively: Sales Project and Sales Solution. Save the application in your work folder. d. Build the interface and then code the Exit button. (You do not need to code the button that calculates and displays the percentages.) e. Save the solution and then start the application. Test the access keys, tab order, and Exit button and then close the solution
Step by Step Solution
There are 3 Steps involved in it

Get step-by-step solutions from verified subject matter experts