

Question
James had an equity portfolio that contains $40,000 investment in Tesla (TSLA) and $60,000 investment in Microsoft (MSFT) since 2018. After seeing the stock market
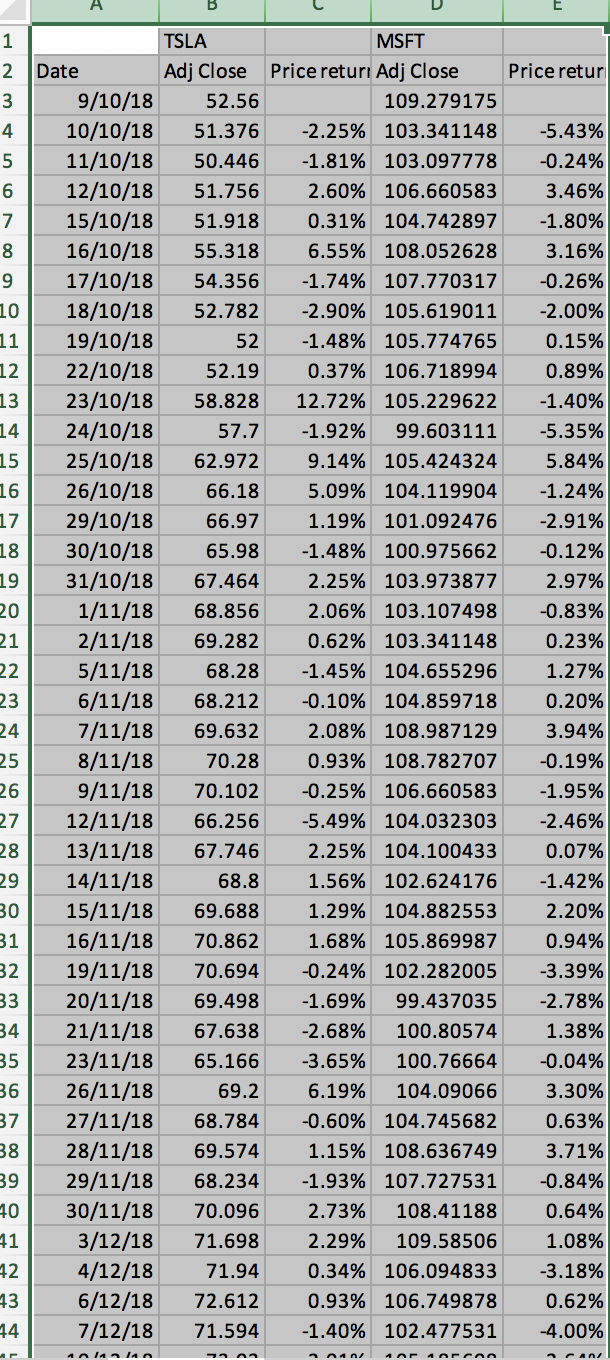
James had an equity portfolio that contains $40,000 investment in Tesla (TSLA) and $60,000 investment in Microsoft (MSFT) since 2018. After seeing the stock market turmoil sparked by coronavirus, he contacted you and seek for some approaches to measure the expected losses of his portfolio. As his investment adviser, you decided to use the model building approach to measure the risk of James' portfolio.
question
a.What is the 10-day 97% value at risk for TSLA and MSFT, respectively?
b. What is the 10-day 97% value at risk for the portfolio?
c.
Step by Step Solution
There are 3 Steps involved in it
Step: 1

Get Instant Access to Expert-Tailored Solutions
See step-by-step solutions with expert insights and AI powered tools for academic success
Step: 2

Step: 3
Ace Your Homework with AI
Get the answers you need in no time with our AI-driven, step-by-step assistance
Get Started
Managerial economics applications strategy and tactics
Authors: James r. mcguigan, R. Charles Moyer, frederick h. deb harris
12th Edition
9781133008071, 1439079234, 1133008070, 978-1439079232