Answered step by step
Verified Expert Solution
Link Copied!

Question

1 Approved Answer

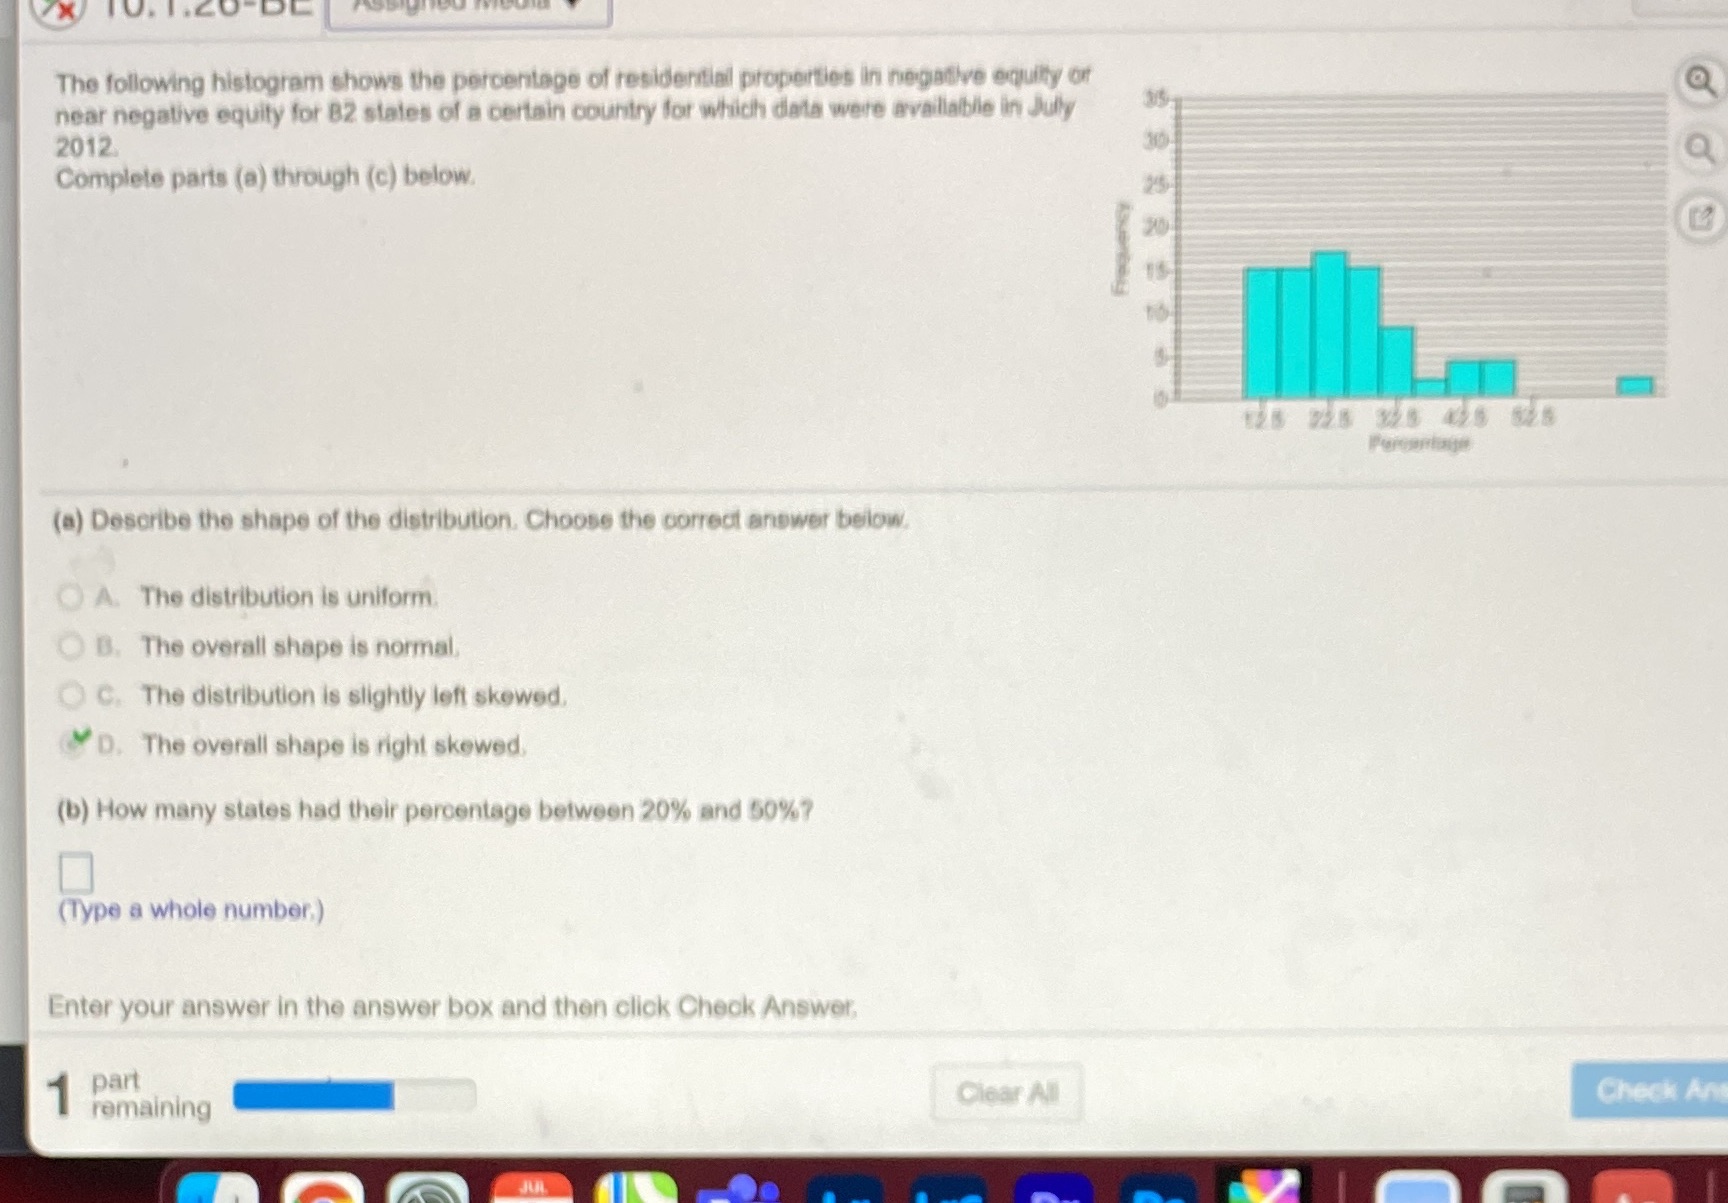
Just need b answered. I am struggling X The following histogram shows the percentage of residential properties in negative equity out near negative equity for

Just need "b" answered. I am struggling

image text in transcribed
X The following histogram shows the percentage of residential properties in negative equity out near negative equity for B2 states of a certain country for which data were available in July 2012 Complete parts (a) through (c) below. 20 (a) Describe the shape of the distribution. Choose the correct answer below O A. The distribution is uniform O B. The overall shape is normal O C. The distribution is slightly left skewed, D. The overall shape is right skewed. (b) How many states had their percentage between 20% and 50%? (Type a whole number.) Enter your answer in the answer box and then click Check Answer, part remaining Clear All Check And

Step by Step Solution

There are 3 Steps involved in it

Step: 1

blur-text-image

Get Instant Access to Expert-Tailored Solutions

See step-by-step solutions with expert insights and AI powered tools for academic success

Step: 2

blur-text-image

Step: 3

blur-text-image

Ace Your Homework with AI

Get the answers you need in no time with our AI-driven, step-by-step assistance

Get Started

Recommended Textbook for

More Books

Students also viewed these Mathematics questions