just need some ratios and explinations to point me in the right direction
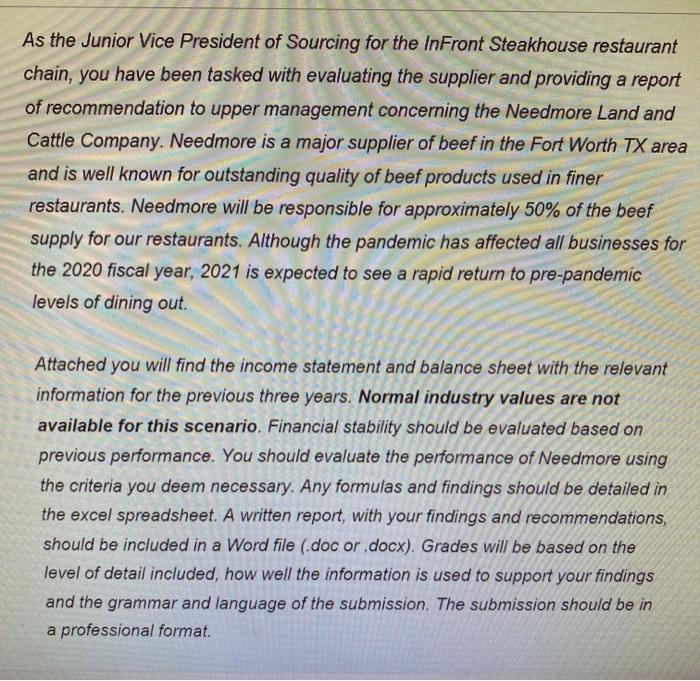
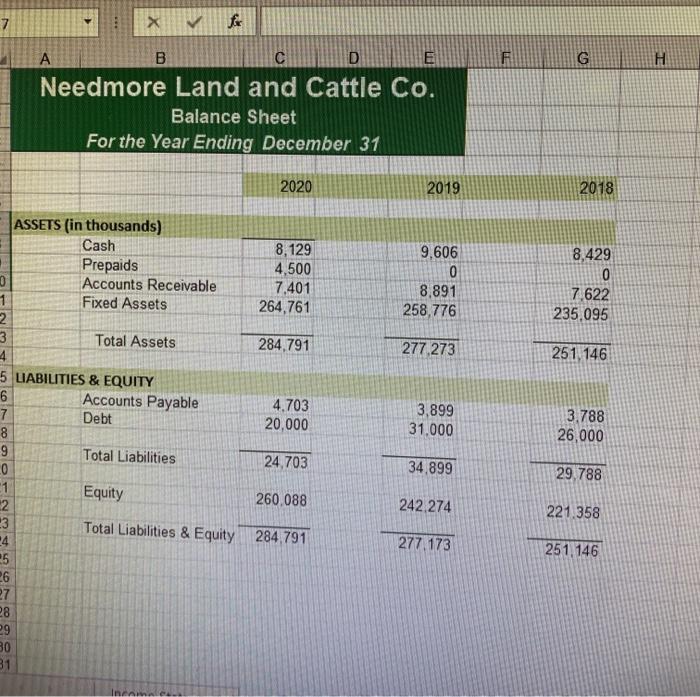
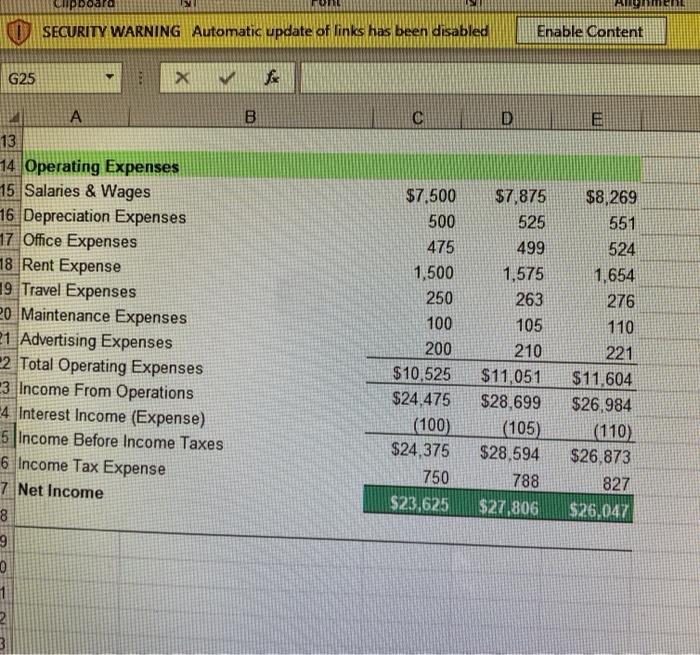
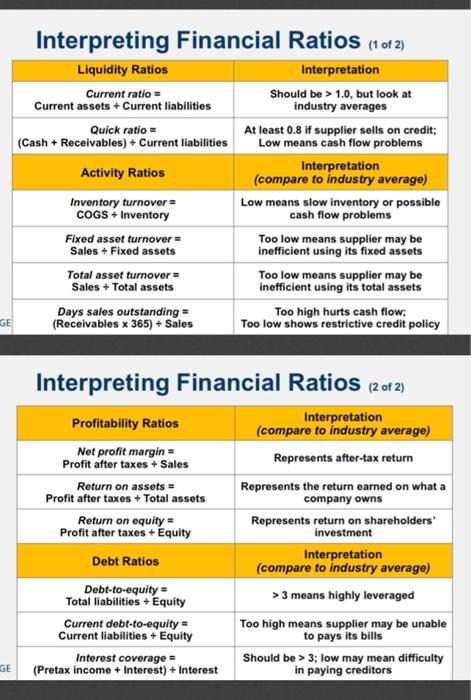
As the Junior Vice President of Sourcing for the InFront Steakhouse restaurant chain, you have been tasked with evaluating the supplier and providing a report of recommendation to upper management concerning the Needmore Land and Cattle Company. Needmore is a major supplier of beef in the Fort Worth TX area and is well known for outstanding quality of beef products used in finer restaurants. Needmore will be responsible for approximately 50% of the beef supply for our restaurants. Although the pandemic has affected all businesses for the 2020 fiscal year, 2021 is expected to see a rapid return to pre-pandemic levels of dining out Attached you will find the income statement and balance sheet with the relevant information for the previous three years. Normal industry values are not available for this scenario. Financial stability should be evaluated based on previous performance. You should evaluate the performance of Needmore using the criteria you deem necessary. Any formulas and findings should be detailed in the excel spreadsheet. A written report, with your findings and recommendations, should be included in a Word file (.doc or .docx). Grades will be based on the level of detail included, how well the information is used to support your findings and the grammar and language of the submission. The submission should be in a professional format. 7 x for F G H A B D E Needmore Land and Cattle Co. Balance Sheet For the Year Ending December 31 2020 2019 2018 8,129 4,500 7,401 264,761 9.606 0 8,891 258,776 8,429 0 7.622 235,095 284,791 277.273 251, 146 ASSETS (in thousands) Cash Prepaids 0 Accounts Receivable 1 Fixed Assets 2 3 Total Assets 4 5 LIABILITIES & EQUITY 6 Accounts Payable 7 Debt 8 9 Total Liabilities 0 1 2 -3 -4 25 4.703 20,000 3,899 31.000 3.788 26,000 24,703 34.899 29.788 Equity 260.088 242.274 221.358 Total Liabilities & Equity 284.791 277.173 251 146 29 30 31 inn SECURITY WARNING Automatic update of links has been disabled Enable Content G25 M B D E 13 14. Operating Expenses 15 Salaries & Wages 16 Depreciation Expenses 17 Office Expenses 18 Rent Expense 19 Travel Expenses 20 Maintenance Expenses 21 Advertising Expenses 2 Total Operating Expenses 3 Income From Operations -4 Interest Income (Expense) 5 Income Before Income Taxes 6 Income Tax Expense 7 Net Income 8 9 0 1 2 3 $7.500 500 475 1,500 250 100 200 $10.525 $24,475 (100) $24,375 750 $23,625 $7,875 525 499 1,575 263 105 210 $11,051 $28,699 (105) $28,594 788 $27,806 $8,269 551 524 1,654 276 110 221 $11,604 $26.984 (110) $26,873 827 $26.047 Interpreting Financial Ratios (1 of 2) Liquidity Ratios Current ratio Current assets + Current liabilities Quick ratio = (Cash + Receivables) + Current liabilities Activity Ratios Inventory turnover = COGS + Inventory Fixed asset turnover Sales + Fixed assets Total asset turnover Sales + Total assets Days sales outstanding = (Receivables x 365) + Sales Interpretation Should be > 1.0, but look at industry averages At least 0.8 if supplier sells on credit; Low means cash flow problems Interpretation (compare to industry average) Low means slow inventory or possible cash flow problems Too low means supplier may be inefficient using its fixed assets Too low means supplier may be inefficient using its total assets Too high hurts cash flow; Too low shows restrictive credit policy GE Interpreting Financial Ratios (2 of 2) Profitability Ratios Interpretation (compare to industry average) Net profit margin Profit after taxes + Sales Represents after-tax return Return on assets = Represents the return earned on what a Profit after taxes + Total assets company owns Return on equity = Represents return on shareholders' Profit after taxes + Equity investment Debt Ratios Interpretation (compare to industry average) Debt-to-equity - Total liabilities - Equity > 3 means highly leveraged Current debt-to-equity = Too high means supplier may be unable Current liabilities + Equity to pays its bills Interest coverage = Should be > 3; low may mean difficulty (Pretax income + Interest) + Interest in paying creditors GE
