Answered step by step
Verified Expert Solution
Question
1 Approved Answer
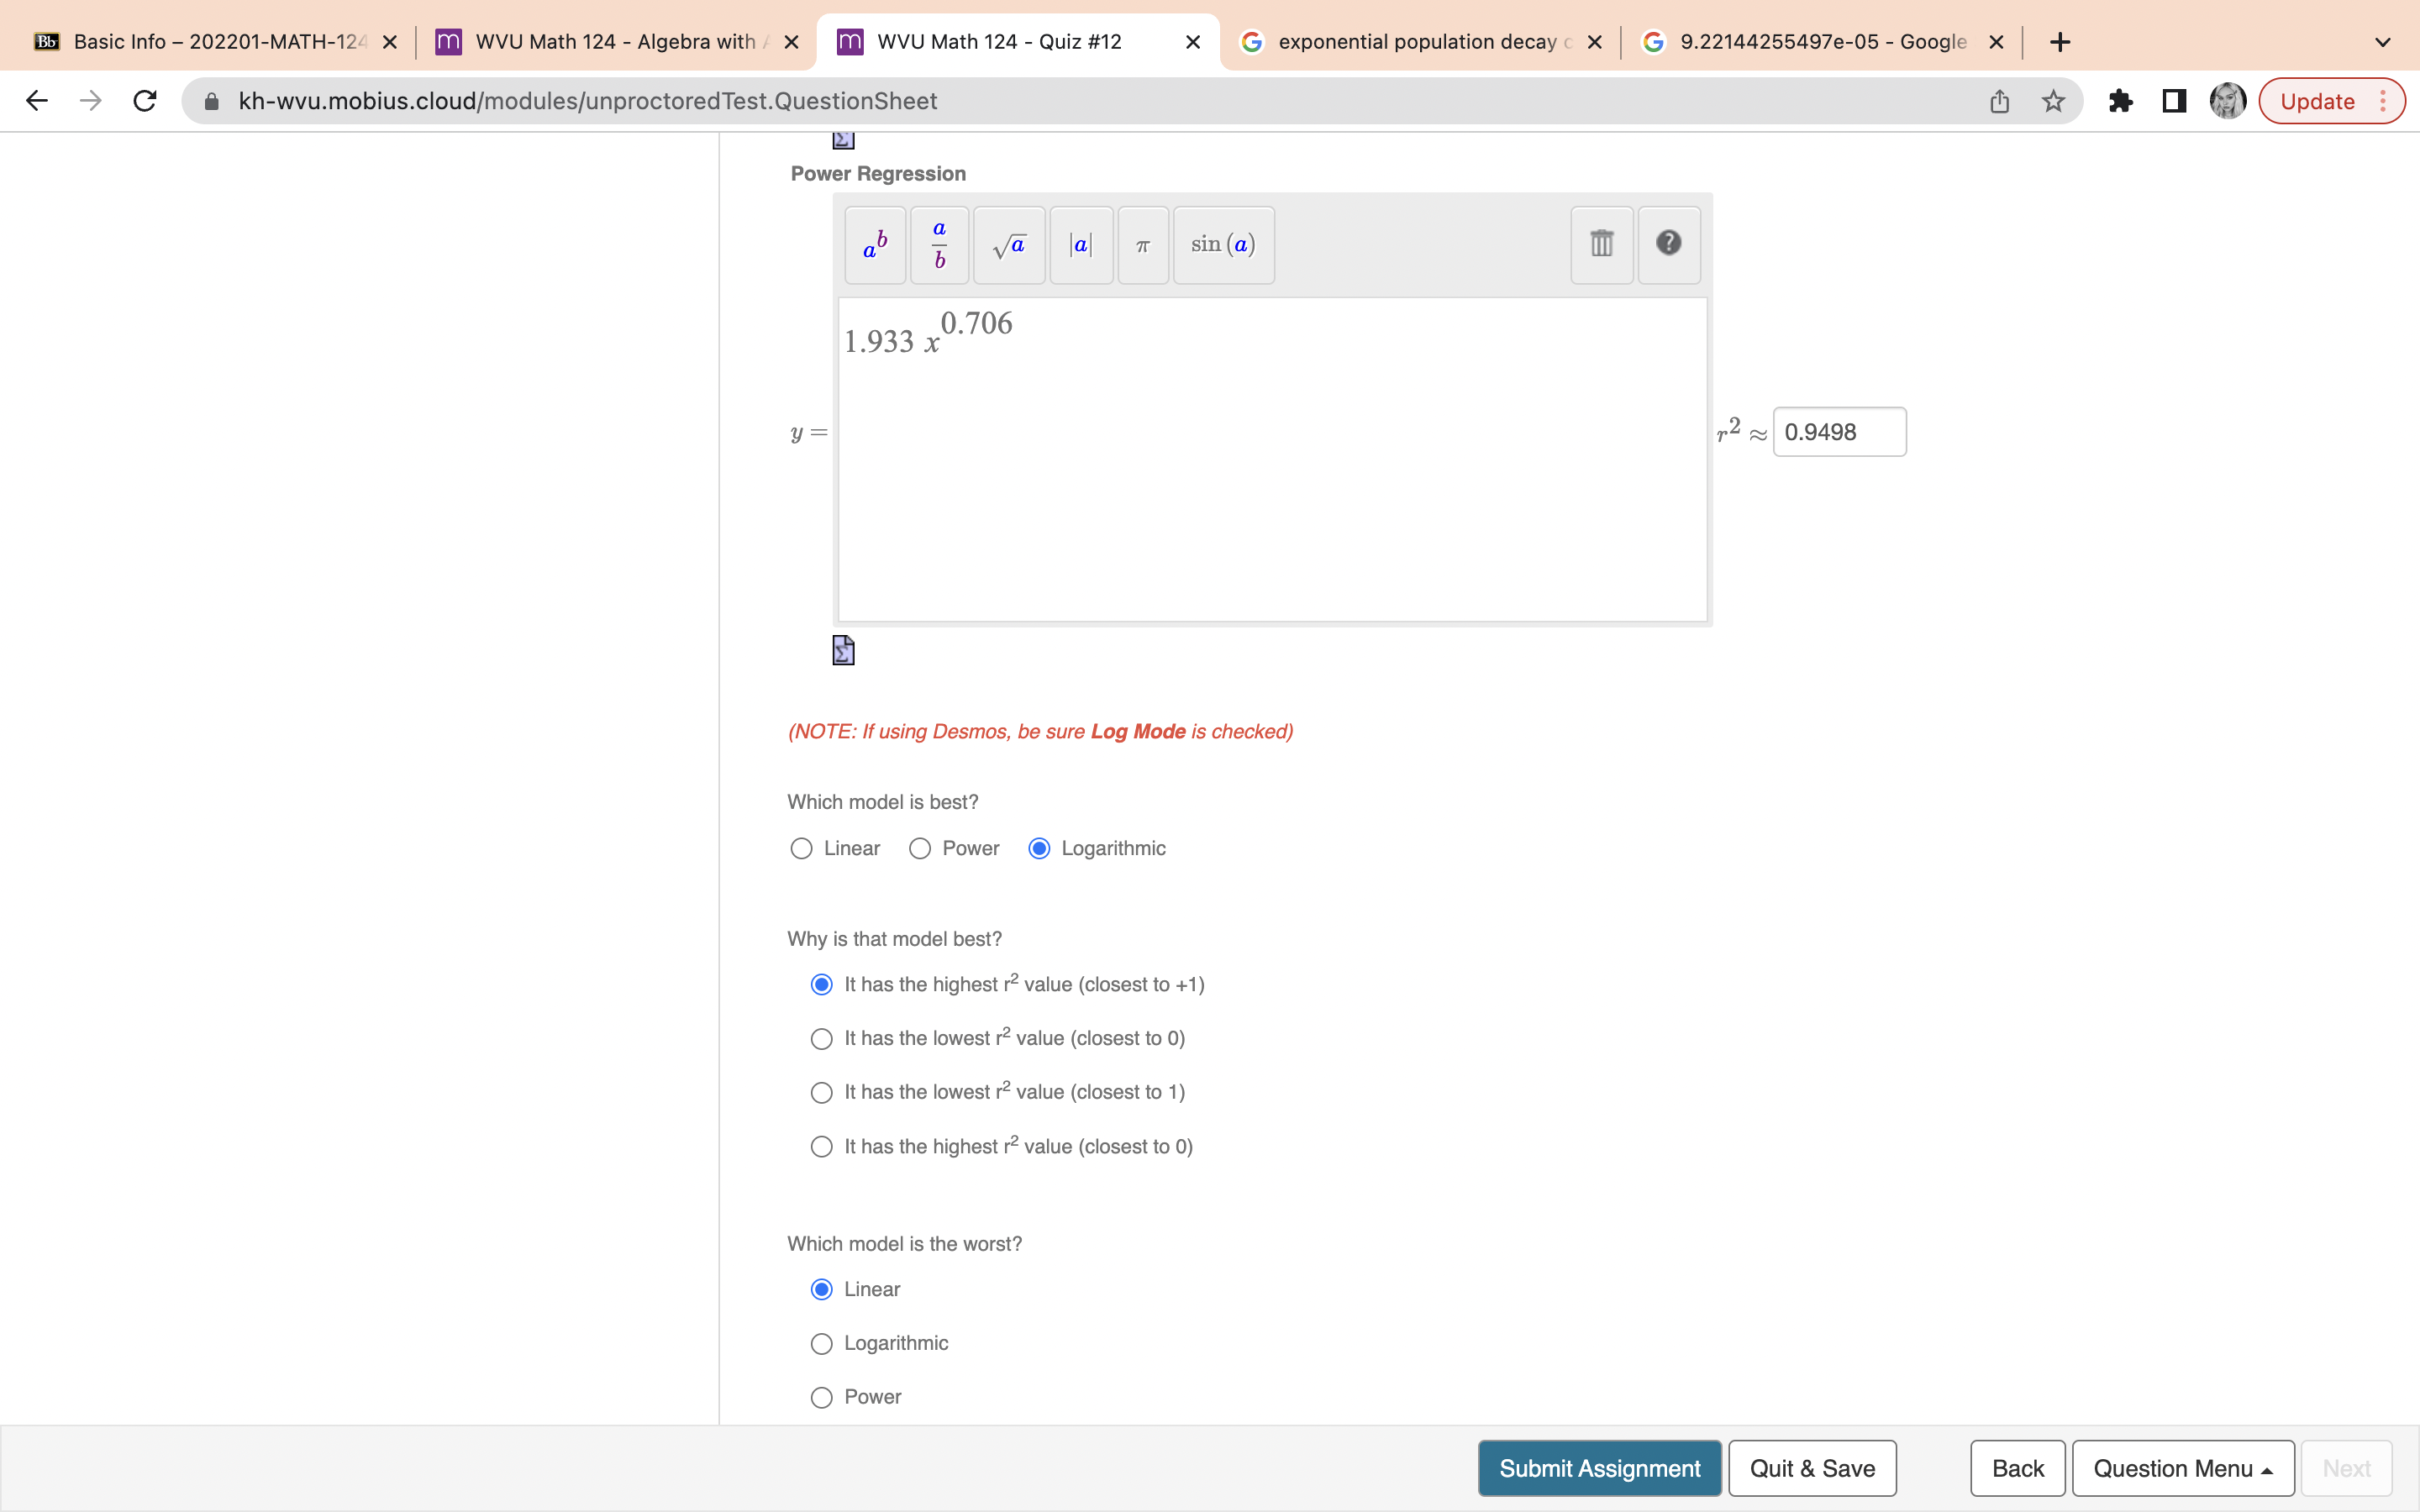
just needing this checked over to see if I did it correctly Bb Basic Info - 202201-MATH-124 x m WVU Math 124 - Algebra with
just needing this checked over to see if I did it correctly
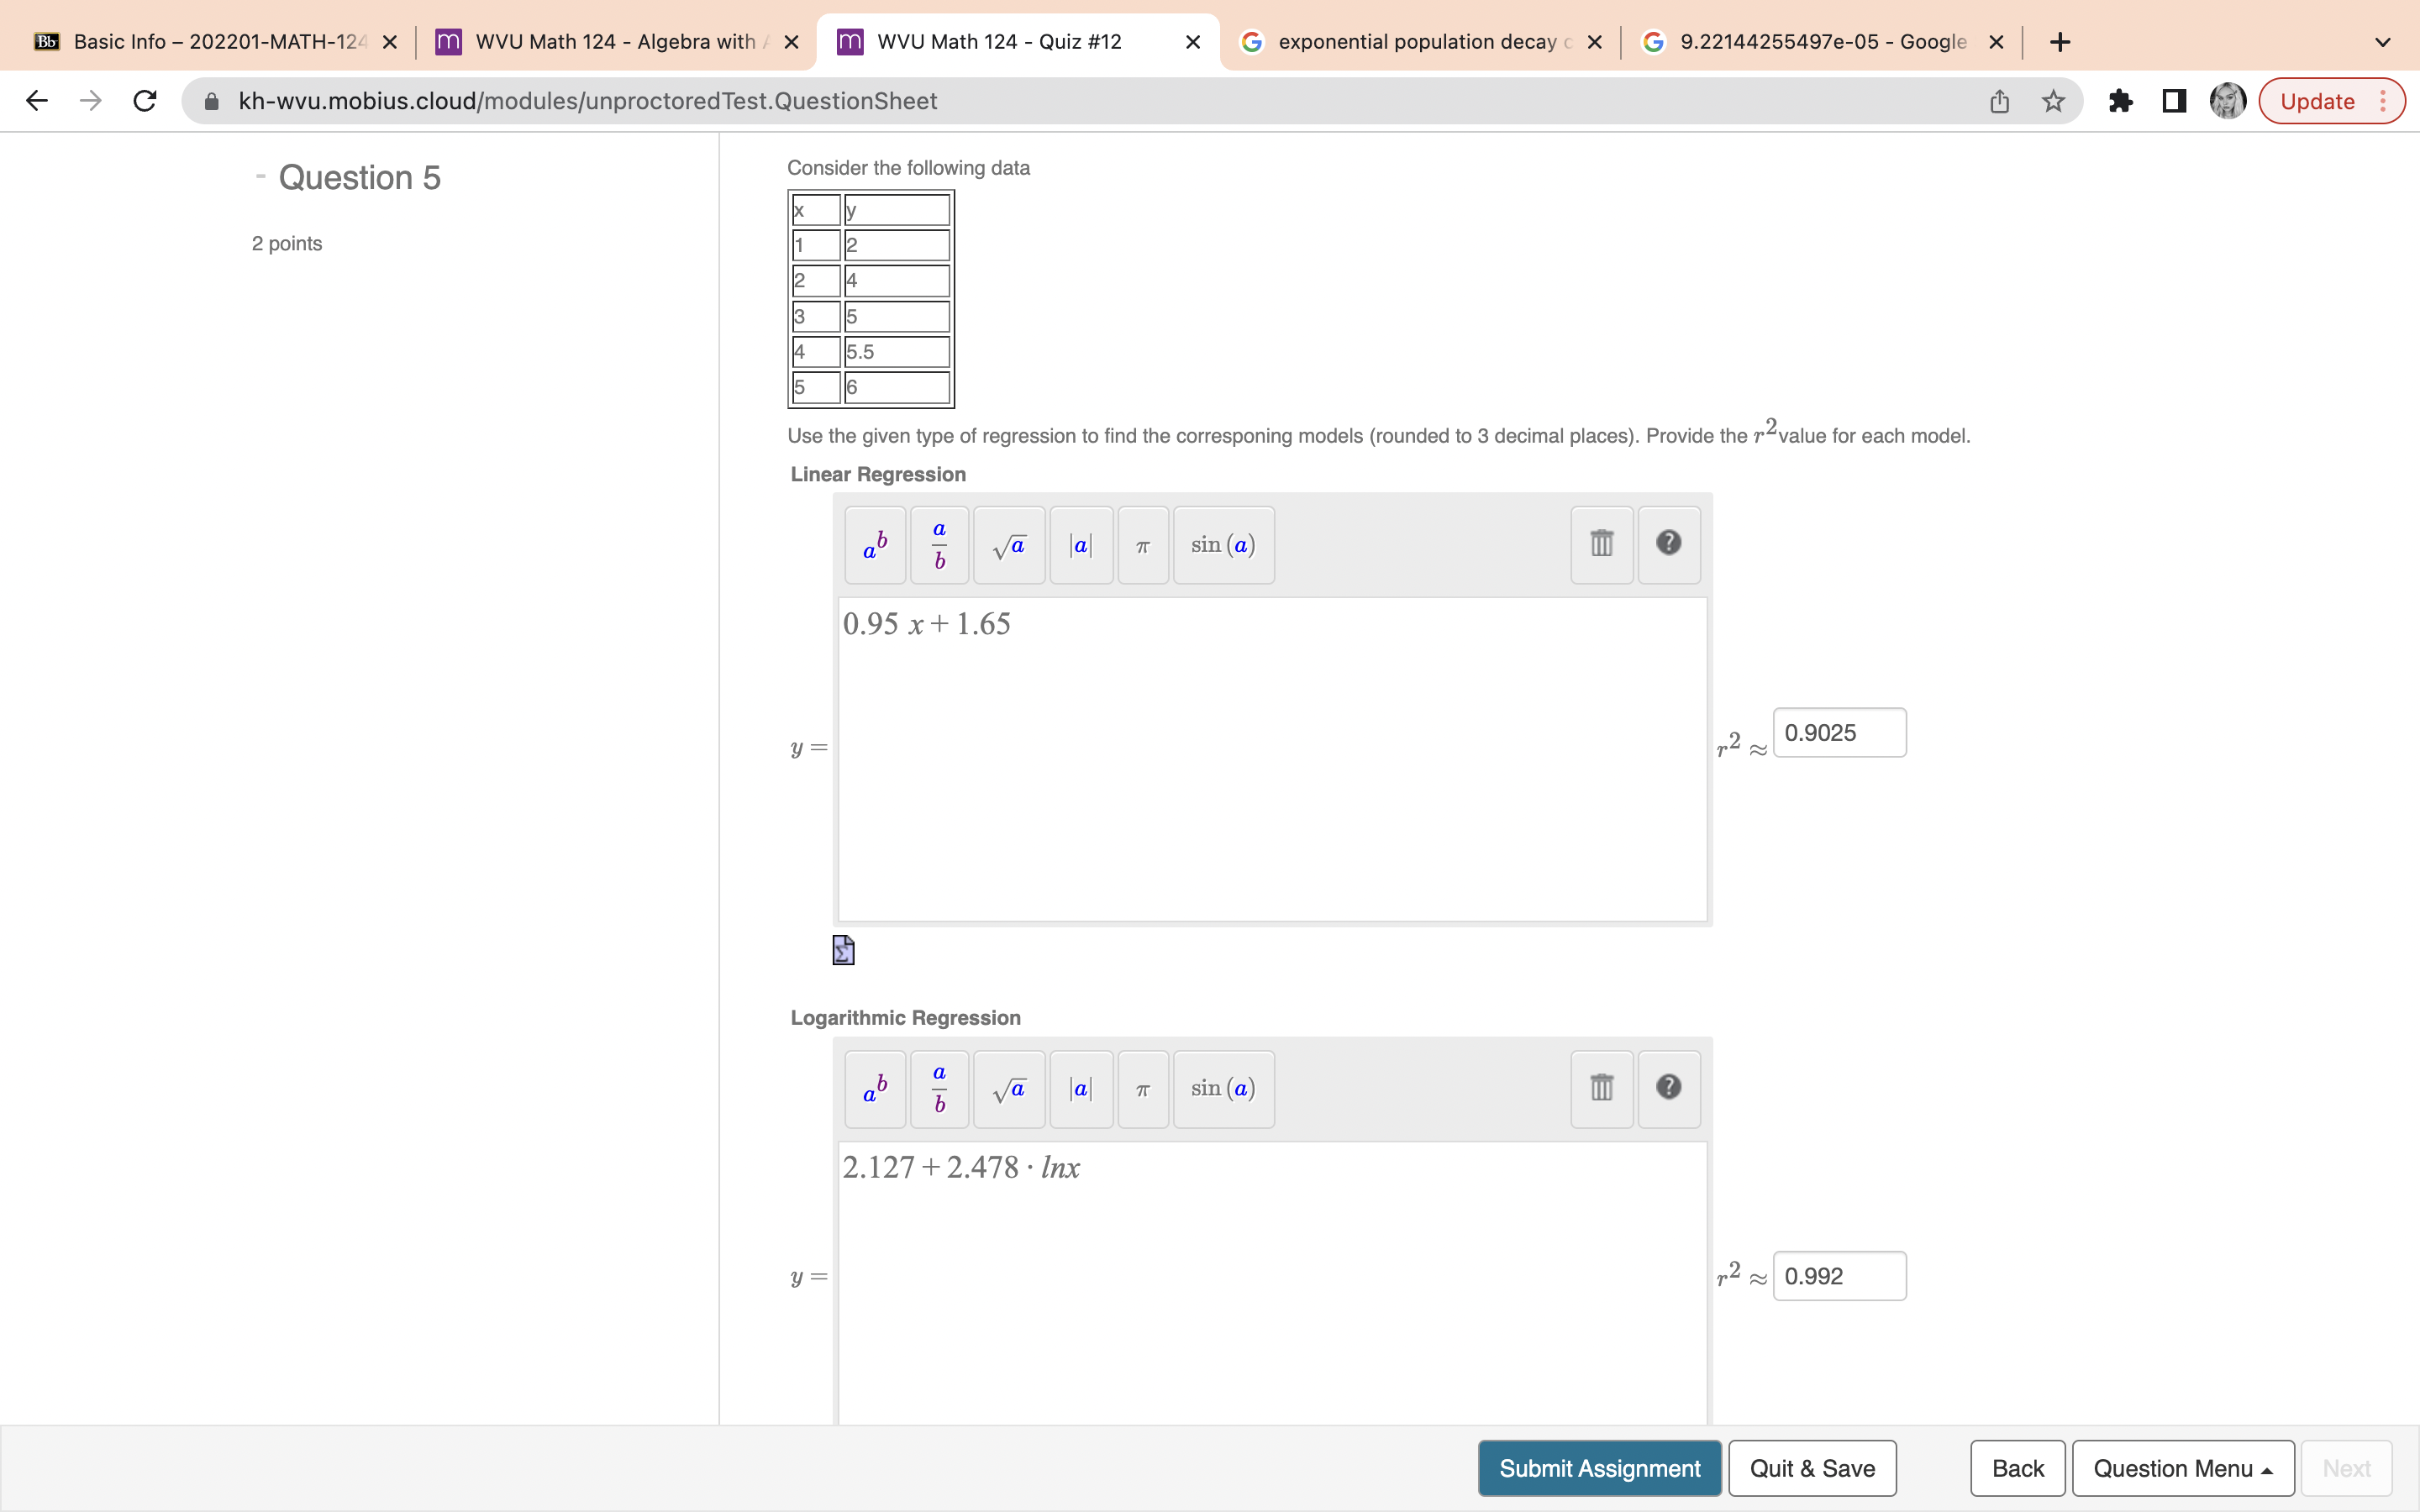
Bb Basic Info - 202201-MATH-124 x m WVU Math 124 - Algebra with / X m WVU Math 124 - Quiz #12 X G exponential population decay c X G 9.22144255497e-05 - Google X + A kh-wvu.mobius.cloud/modules/unproctoredTest. QuestionSheet Update Question 5 Consider the following data 2 points 5 15.5 15 16 Use the given type of regression to find the corresponding models (rounded to 3 decimal places). Provide the r value for each model. Linear Regression ab a a a TT sin (a) ? 0.95 x + 1.65 y = 0.9025 Logarithmic Regression a a Va la TT sin (a) ? 2.127 + 2.478 . Inx y = r2 ~ 0.992 Submit Assignment Quit & Save Back Question Menu NextBb Basic Info - 202201-MATH-124 X m WVU Math 124 - Algebra with / X m WVU Math 124 - Quiz #12 X G exponential population decay c X G 9.22144255497e-05 - Google X + akh-wvu.mobius.cloud/modules/unproctoredTest. QuestionSheet Update Power Regression a a a sin (a) ? ON / 1.933 x 0.706 y = r2 ~ 0.9498 (NOTE: If using Desmos, be sure Log Mode is checked) Which model is best? O Linear O Power O Logarithmic Why is that model best? It has the highest r2 value (closest to +1) It has the lowest r2 value (closest to 0) It has the lowest r2 value (closest to 1) It has the highest r2 value (closest to 0) Which model is the worst? O Linear O Logarithmic Power Submit Assignment Quit & Save Back Question Menu NextStep by Step Solution
There are 3 Steps involved in it
Step: 1
Get Instant Access to Expert-Tailored Solutions
See step-by-step solutions with expert insights and AI powered tools for academic success
Step: 2
Step: 3
Ace Your Homework with AI
Get the answers you need in no time with our AI-driven, step-by-step assistance
Get Started