Just very simple question!!! Please answer only if you have R-STUDIO !!!
You can copy-paste the data, at least 4 decimals!!
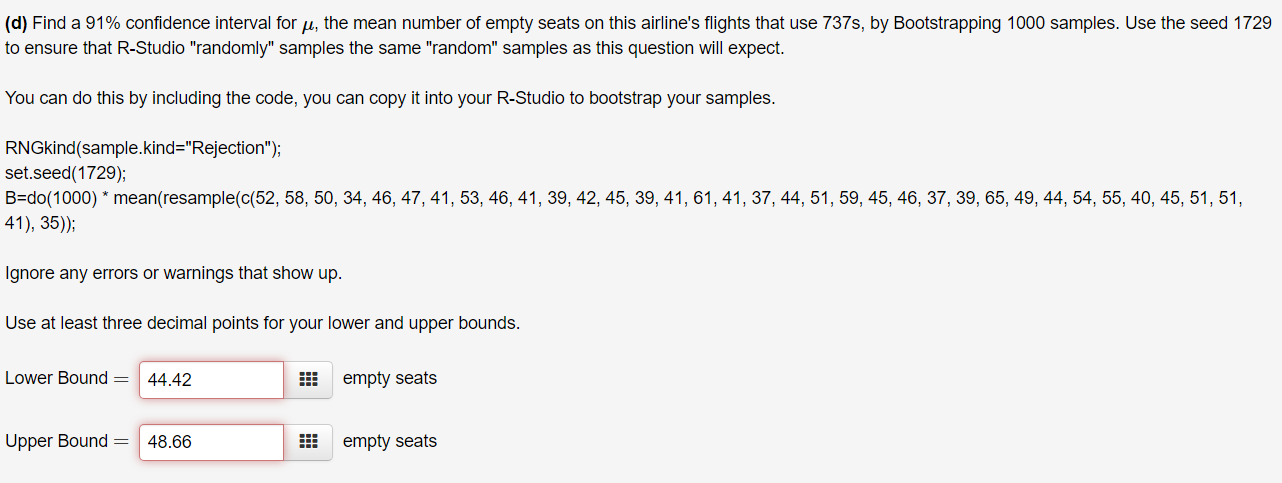
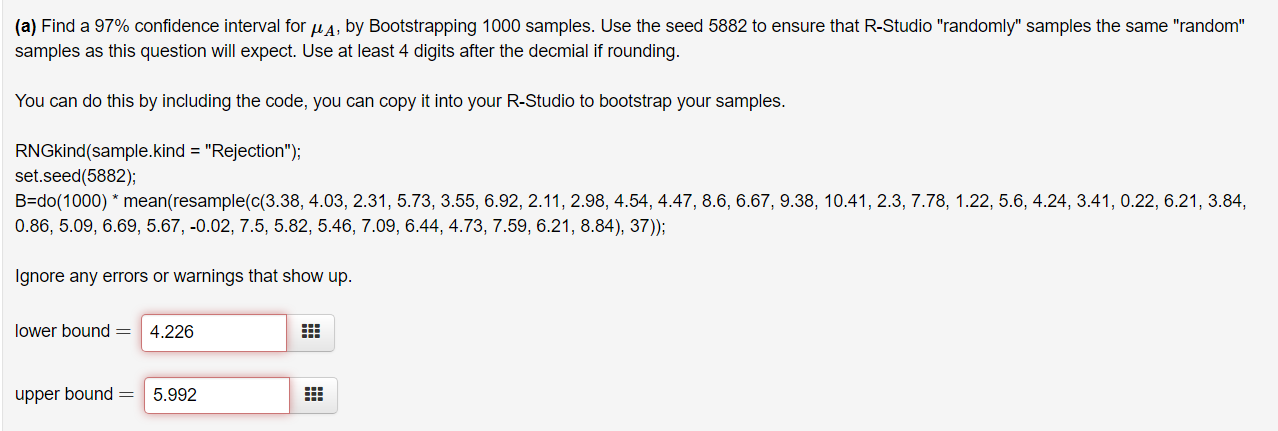
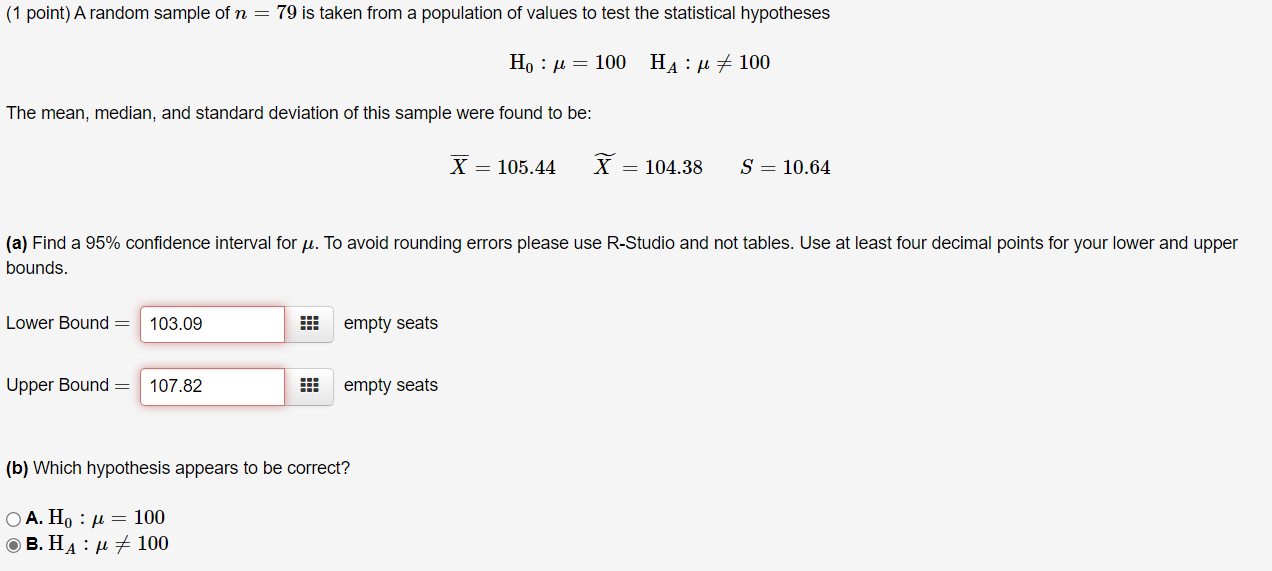
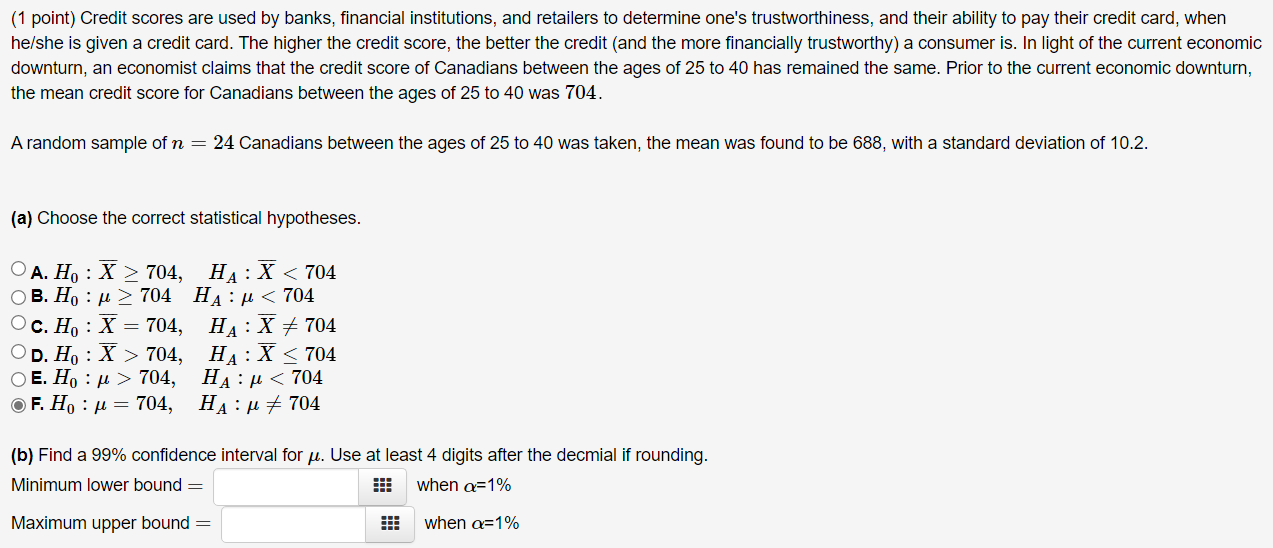
{:1} Find a 91% condence interval for p... the mean number of empty seats on this airline's ights that use T3Ts, by Bootstrapping 1000 samples. Use the seed 1729 to ensure that RStudio \"randomly" samples the same \"random" samples as this question will expect. You can do this by including the code, you can copy it into your RStudio to bootstrap your samples. RNGkind[sample.kind="Rejection"); set.seed(1729); B=do(1000) ' mean(resample(c{52, 58, 50, 34, 46, 47, 41, 53,46, 41, 39, 42, 45, 39, 41, 61, 41, 37,44, 51, 59,45, 46, 37, 39, 55, 49, 44,54, 55, 40,45, 51, 51, 41). 35)); Ignore any errors or warnings that show up. Use at least three decimal points for your lower and upper bounds. Lower Bound = 4442 _ EEE empty seats Upper Bound = 48.06 552 empty seats (a) Find a 97% condence interval for \"A, by Bootstrapping 1000 samples. Use the seed 5882 to ensure that RStudio \"randomly" samples the same "random" samples as this question will expect. Use at least 4 digits after the deomial if rounding. You can do this by including the code, you can oopy it into your RStudio to bootstrap your samples. RNGkind(sample.kind = "Rejection"); set.seed(5882); B=do(1000}' mean(resample(o(3.38, 4.03, 2.31, 5.73, 3.55, 6.92, 2.11, 2.98, 4.54, 4.47, 8.6, 6.67, 9.38, 10.41, 2.3, 7.78, 1.22, 5.6, 4.24, 3.41, 0.22, 6.21, 3.84, 0.86, 5.09, 6.69, 5.67, -0.02, 7.5, 5.82, 5.46, 7.09, 6.44, 4.73, 7.59, 6.21, 6.84), 37)}; Ignore any errors or warnings that show up. lower bound : 4.226 _ upper bound : 5.992 _ (b) Using your answer in (a), find a 91% confidence interval for Pnow, the current proportion of 20 to 24 year old Canadians who are smokers, by Bootstrapping 1000 samples. Use the seed 5061 to ensure that R-Studio "randomly" samples the same "random" samples as this question will expect. You can do this by including the code, you can copy it into your R-Studio to bootstrap your samples. RNGkind(sample.kind = "Rejection"); set.seed(5061); B=do(1000) * mean(resample(c(rep(1, 153),rep(0,326-153)), 326)); Use at least four decimals in all your calculations. lower bound = upper bound :(1 point) A random sample of n = 79 is taken from a population of values to test the statistical hypotheses Ho : / = 100 HA : / # 100 The mean, median, and standard deviation of this sample were found to be: X = 105.44 X = 104.38 S = 10.64 (a) Find a 95% confidence interval for . To avoid rounding errors please use R-Studio and not tables. Use at least four decimal points for your lower and upper bounds. Lower Bound = 103.09 empty seats Upper Bound = 107.82 empty seats (b) Which hypothesis appears to be correct? OA. Ho : M = 100 OB. HA : M # 100Find a 95% condence interval for ,u, by Bootstrapping 1000 samples. Use the seed 1400 to ensure that RStudio "randomly" samples the same "random" samples as this question will expect. Use at least 4 digits after the decmial if rounding. You can do this by including the code, you can copy it into your RStudio to bootstrap your samples. RNGkind(sampIe.kind = "Rejection"); set.seed(1400); B=do(1000}' mean(resample(c(15.19, 12.04, 11.04, 15.54, 1459,1255, 15.01, 12.21, 12.17, 13.1, 12.54, 14.17, 13.75, 13.45, 14.31, 11.59, 10.54, 15.05, 11.71, 17.55, 12.45, 9.5, 12.95, 14.53, 10.95, 15.5, 13.33, 12.29, 12.93, 11.52, 5.53, 14.35, 11.52, 10.54, 10.25}, 35)), Minimum lower bound : when a=5% Maximum upper bound 2 when a=5% (1 point) Credit scores are used by banks, financial institutions, and retailers to determine one's trustworthiness, and their ability to pay their credit card, when he/she is given a credit card. The higher the credit score, the better the credit (and the more financially trustworthy) a consumer is. In light of the current economic downturn, an economist claims that the credit score of Canadians between the ages of 25 to 40 has remained the same. Prior to the current economic downturn, the mean credit score for Canadians between the ages of 25 to 40 was 704. A random sample of n = 24 Canadians between the ages of 25 to 40 was taken, the mean was found to be 688, with a standard deviation of 10.2. (a) Choose the correct statistical hypotheses. OA. Ho : X > 704, HA : X 704 HA : M 704, HA : X 704, HA : M
