Answered step by step
Verified Expert Solution
Link Copied!

Question

1 Approved Answer

JUUSULW.ICUSCI Abstract Brooks Hamilton recently completed his third year in college and has just started a summer internship at a prestigious Wall Street investment firm.
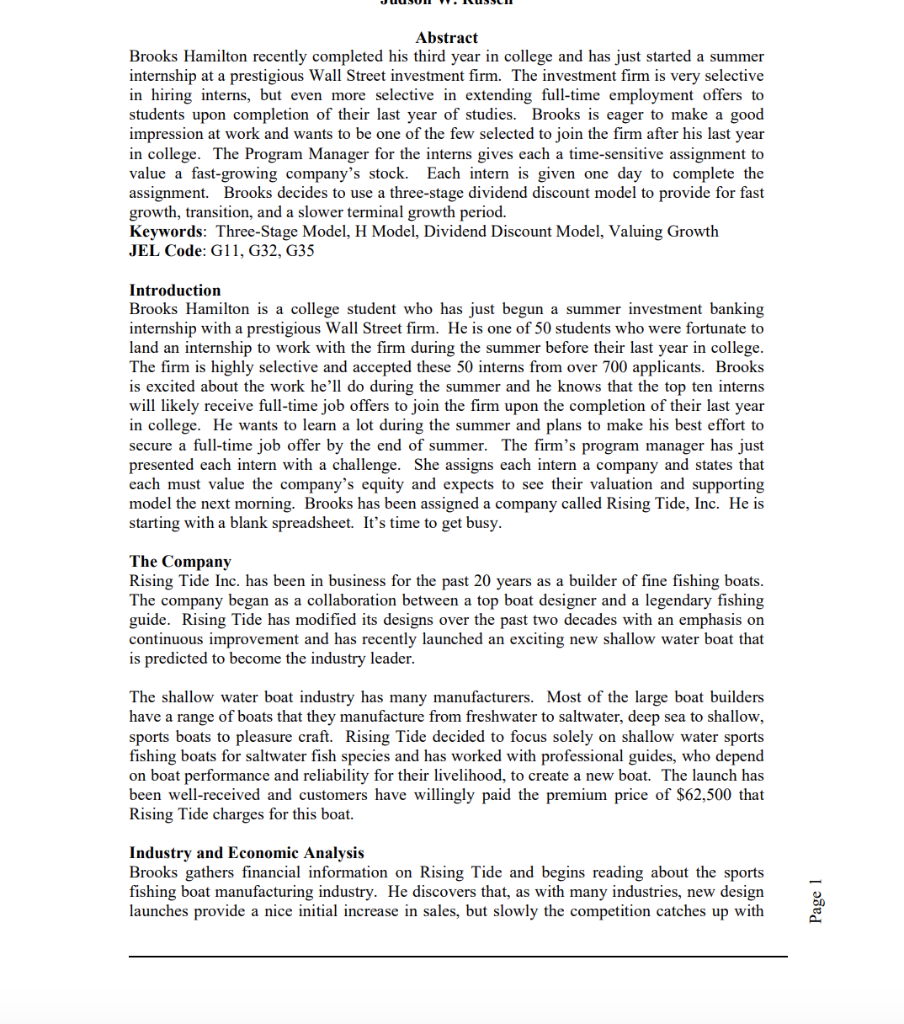
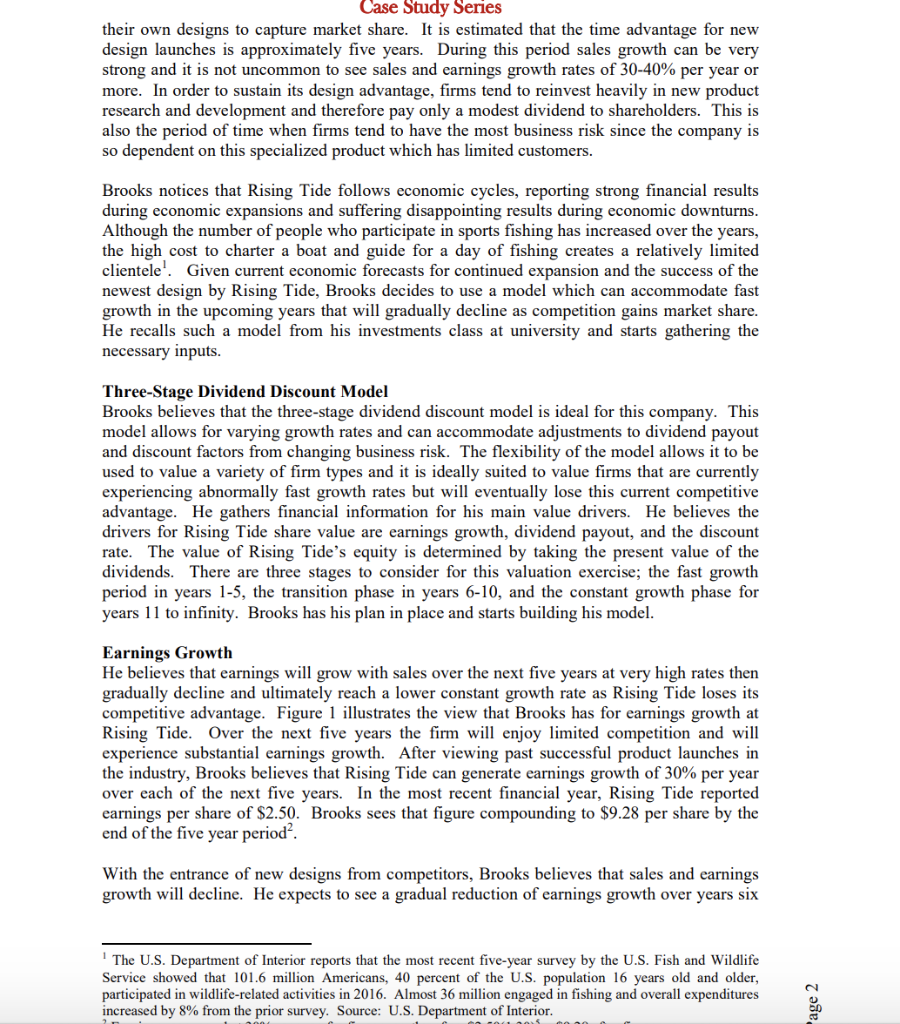
image text in transcribed

image text in transcribed

image text in transcribed

image text in transcribed

image text in transcribed

image text in transcribed

image text in transcribed

image text in transcribed

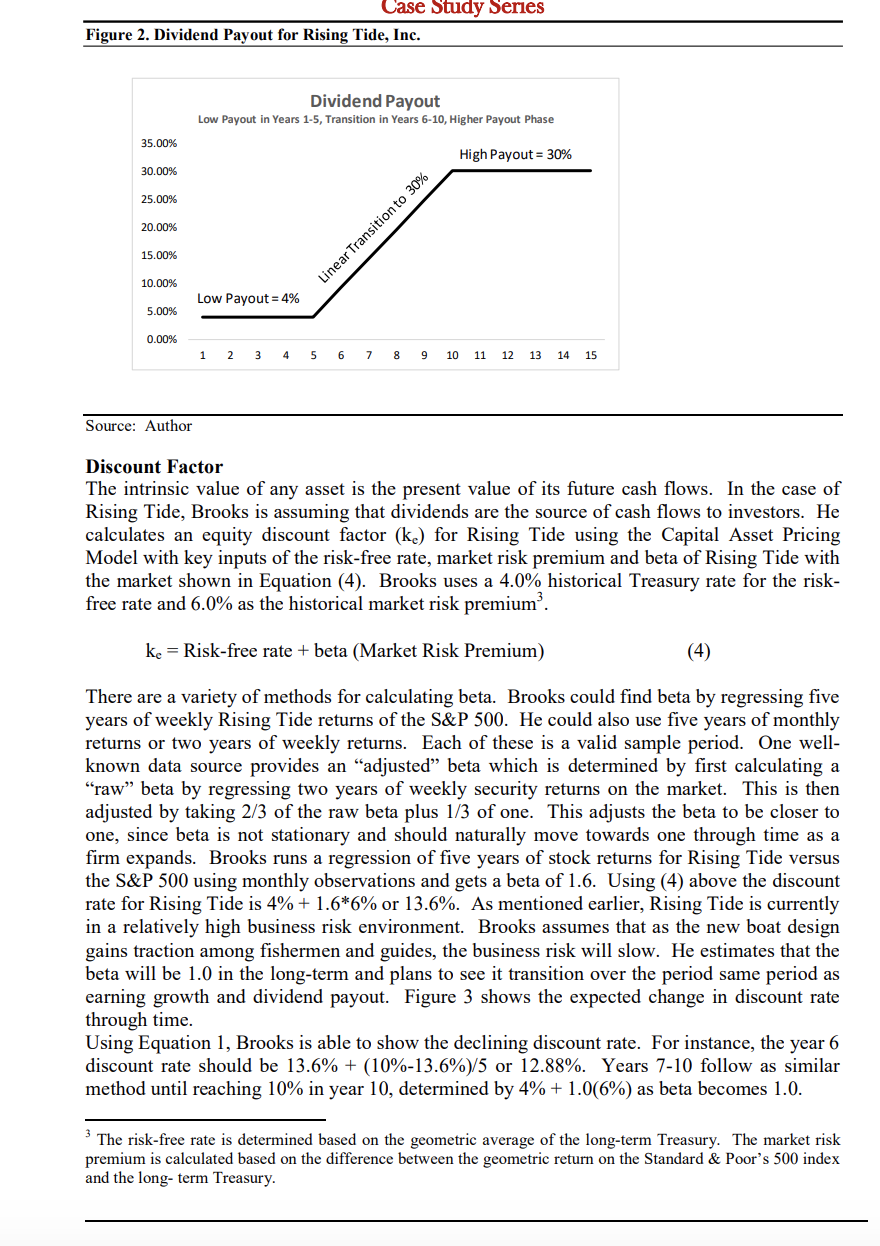
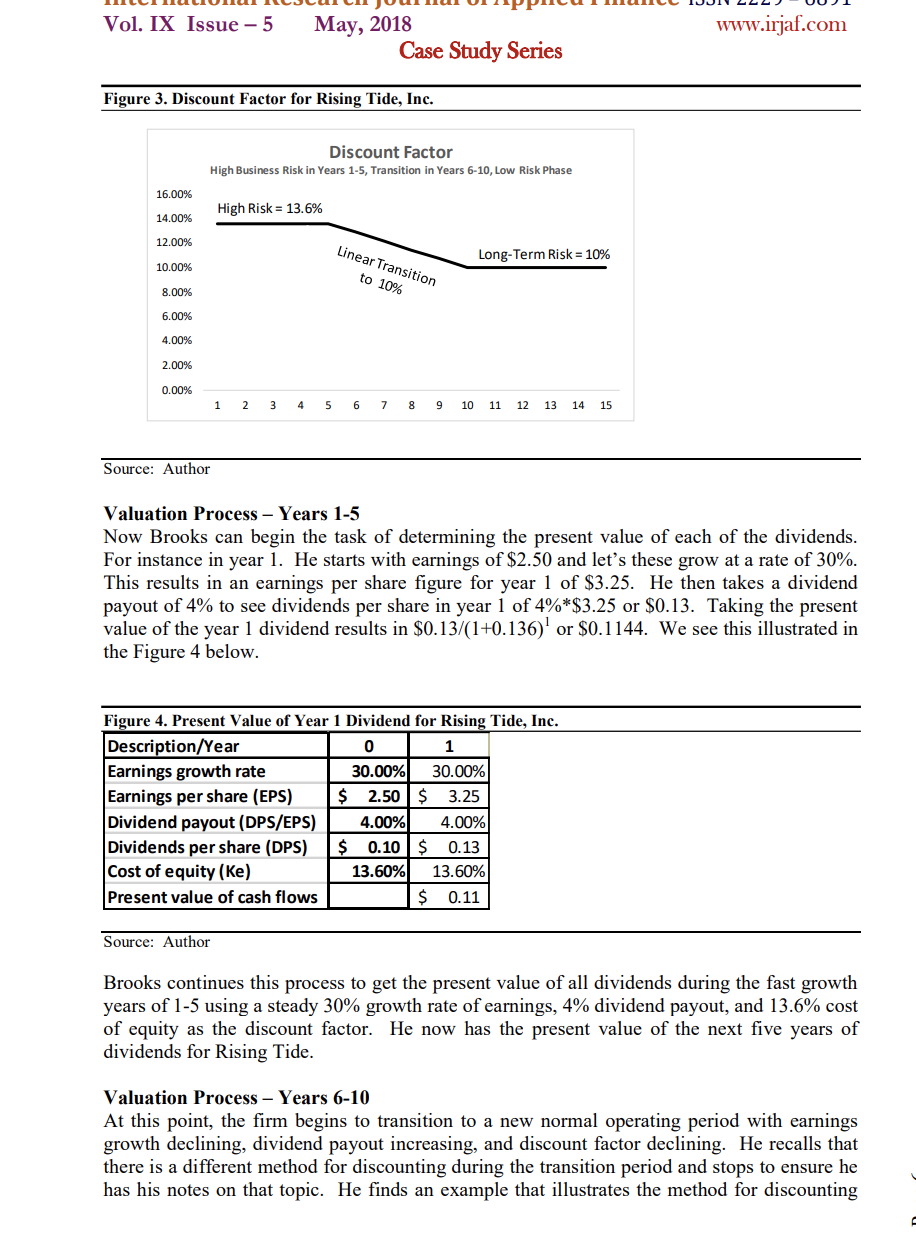
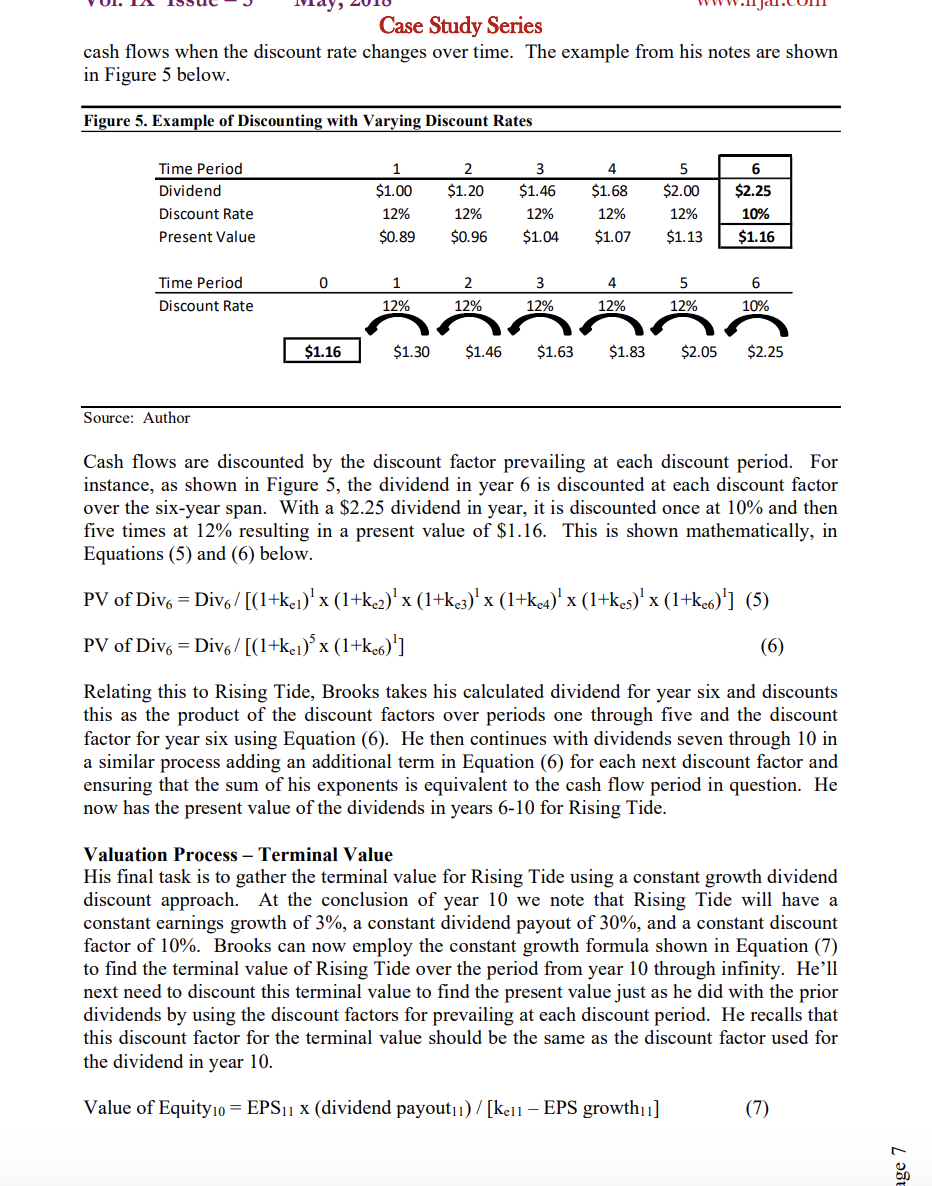
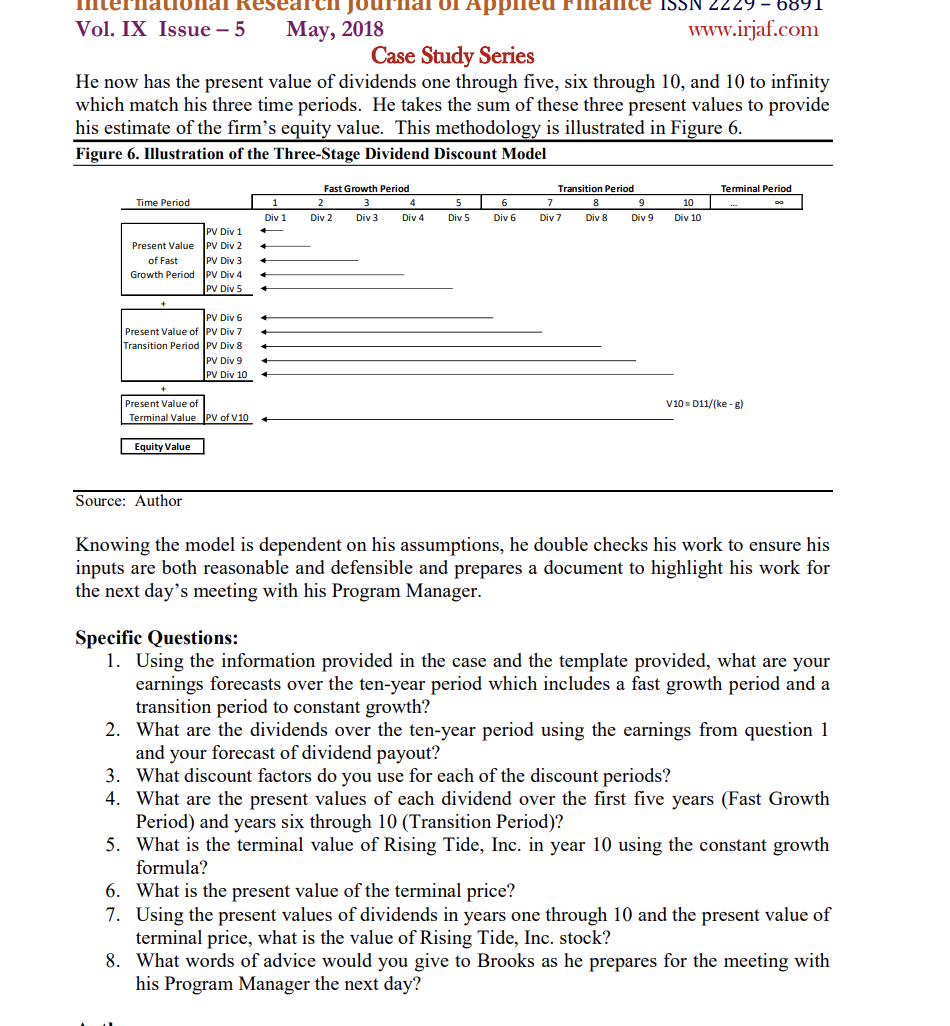
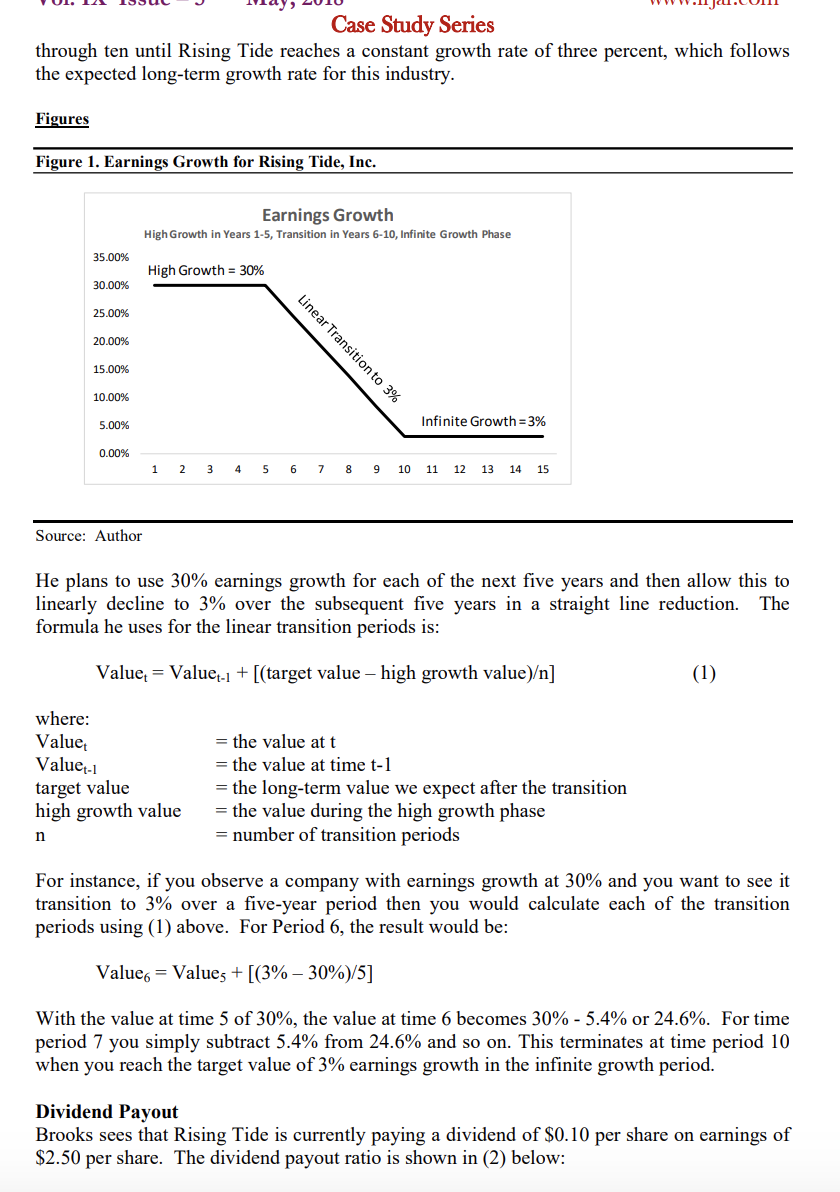
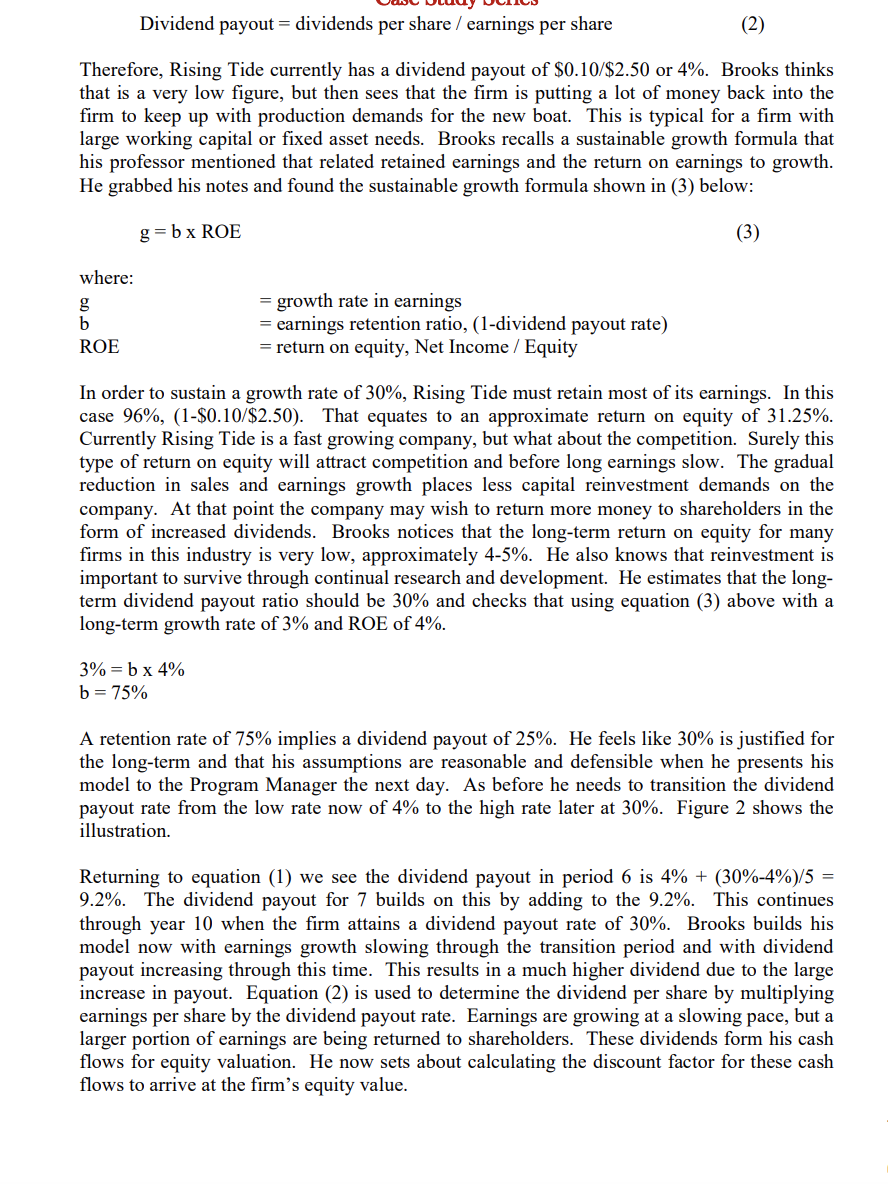
JUUSULW.ICUSCI Abstract Brooks Hamilton recently completed his third year in college and has just started a summer internship at a prestigious Wall Street investment firm. The investment firm is very selective in hiring interns, but even more selective in extending full-time employment offers to students upon completion of their last year of studies. Brooks is eager to make a good impression at work and wants to be one of the few selected to join the firm after his last year in college. The Program Manager for the interns gives each a time-sensitive assignment to value a fast-growing company's stock. Each intern is given one day to complete the assignment. Brooks decides to use a three-stage dividend discount model to provide for fast growth, transition, and a slower terminal growth period. Keywords: Three-Stage Model, H Model, Dividend Discount Model, Valuing Growth JEL Code: G11, G32, G35 Introduction Brooks Hamilton is a college student who has just begun a summer investment banking internship with a prestigious Wall Street firm. He is one of 50 students who were fortunate to land an internship to work with the firm during the summer before their last year in college. The firm is highly selective and accepted these 50 interns from over 700 applicants. Brooks is excited about the work he'll do during the summer and he knows that the top ten interns will likely receive full-time job offers to join the firm upon the completion of their last year in college. He wants to learn a lot during the summer and plans to make his best effort to secure a full-time job offer by the end of summer. The firm's program manager has just presented each intern with a challenge. She assigns each intern a company and states that each must value the company's equity and expects to see their valuation and supporting model the next morning. Brooks has been assigned a company called Rising Tide, Inc. He is starting with a blank spreadsheet. It's time to get busy. The Company Rising Tide Inc. has been in business for the past 20 years as a builder of fine fishing boats. The company began as a collaboration between a top boat designer and a legendary fishing guide. Rising Tide has modified its designs over the past two decades with an emphasis on continuous improvement and has recently launched an exciting new shallow water boat that is predicted to become the industry leader. The shallow water boat industry has many manufacturers. Most of the large boat builders have a range of boats that they manufacture from freshwater to saltwater, deep sea to shallow, sports boats to pleasure craft. Rising Tide decided to focus solely on shallow water sports fishing boats for saltwater fish species and has worked with professional guides, who depend on boat performance and reliability for their livelihood, to create a new boat. The launch has been well-received and customers have willingly paid the premium price of $62,500 that Rising Tide charges for this boat. Industry and Economic Analysis Brooks gathers financial information on Rising Tide and begins reading about the sports fishing boat manufacturing industry. He discovers that, as with many industries, new design launches provide a nice initial increase in sales, but slowly the competition catches up with Page 1 Case Study Series their own designs to capture market share. It is estimated that the time advantage for new design launches is approximately five years. During this period sales growth can be very strong and it is not uncommon to see sales and earnings growth rates of 30-40% per year or more. In order to sustain its design advantage, firms tend to reinvest heavily in new product research and development and therefore pay only a modest dividend to shareholders. This is also the period of time when firms tend to have the most business risk since the company is so dependent on this specialized product which has limited customers. Brooks notices that Rising Tide follows economic cycles, reporting strong financial results during economic expansions and suffering disappointing results during economic downturns. Although the number of people who participate in sports fishing has increased over the years, the high cost to charter a boat and guide for a day of fishing creates a relatively limited clientele! Given current economic forecasts for continued expansion and the success of the newest design by Rising Tide, Brooks decides to use a model which can accommodate fast growth in the upcoming years that will gradually decline as competition gains market share. He recalls such a model from his investments class at university and starts gathering the necessary inputs. Three-Stage Dividend Discount Model Brooks believes that the three-stage dividend discount model is ideal for this company. This model allows for varying growth rates and can accommodate adjustments to dividend payout and discount factors from changing business risk. The flexibility of the model allows it to be used to value a variety of firm types and it is ideally suited to value firms that are currently experiencing abnormally fast growth rates but will eventually lose this current competitive advantage. He gathers financial information for his main value drivers. He believes the drivers for Rising Tide share value are earnings growth, dividend payout, and the discount rate. The value of Rising Tide's equity is determined by taking the present value of the dividends. There are three stages to consider for this valuation exercise; the fast growth period in years 1-5, the transition phase in years 6-10, and the constant growth phase for years 11 to infinity. Brooks has his plan in place and starts building his model. Earnings Growth He believes that earnings will grow with sales over the next five years at very high rates then gradually decline and ultimately reach a lower constant growth rate as Rising Tide loses its competitive advantage. Figure 1 illustrates the view that Brooks has for earnings growth at Rising Tide. Over the next five years the firm will enjoy limited competition and will experience substantial earnings growth. After viewing past successful product launches in the industry, Brooks believes that Rising Tide can generate earnings growth of 30% per year over each of the next five years. In the most recent financial year, Rising Tide reported earnings per share of $2.50. Brooks sees that figure compounding to $9.28 per share by the end of the five year period? With the entrance of new designs from competitors, Brooks believes that sales and earnings growth will decline. He expects to see a gradual reduction of earnings growth over years six The U.S. Department of Interior reports that the most recent five-year survey by the U.S. Fish and Wildlife Service showed that 101.6 million Americans, 40 percent of the U.S. population 16 years old and older, participated in wildlife-related activities in 2016. Almost 36 million engaged in fishing and overall expenditures increased by 8% from the prior survey. Source: U.S. Department of Interior. age 2 VUI, 21 ISSUC J 142010 WWW.11J.COM Case Study Series through ten until Rising Tide reaches a constant growth rate of three percent, which follows the expected long-term growth rate for this industry. Figures Figure 1. Earnings Growth for Rising Tide, Inc. Earnings Growth High Growth in Years 1-5, Transition in Years 6-10, Infinite Growth Phase 35.00% High Growth = 30% 30.00% 25.00% 20.00% 15.00% Linear Transition to 3% 10.00% 5.00% Infinite Growth = 3% 0.00% 1 2 3 4 5 6 7 8 9 10 11 12 13 14 15 Source: Author He plans to use 30% earnings growth for each of the next five years and then allow this to linearly decline to 3% over the subsequent five years in a straight line reduction. The formula he uses for the linear transition periods is: Value, = Value-1 + [(target value - high growth value)] where: Value Valuet-1 target value high growth value = the value at t = the value at time t-1 = the long-term value we expect after the transition = the value during the high growth phase = number of transition periods For instance, if you observe a company with earnings growth at 30% and you want to see it transition to 3% over a five-year period then you would calculate each of the transition periods using (1) above. For Period 6, the result would be: Value = Values + [(3% - 30%)/5] With the value at time 5 of 30%, the value at time 6 becomes 30% - 5.4% or 24.6%. For time period 7 you simply subtract 5.4% from 24.6% and so on. This terminates at time period 10 when you reach the target value of 3% earnings growth in the infinite growth period. Dividend Payout Brooks sees that Rising Tide is currently paying a dividend of $0.10 per share on earnings of $2.50 per share. The dividend payout ratio is shown in (2) below: Uul Uluay UCITUD Dividend payout = dividends per share / earnings per share Therefore, Rising Tide currently has a dividend payout of $0.10/$2.50 or 4%. Brooks thinks that is a very low figure, but then sees that the firm is putting a lot of money back into the firm to keep up with production demands for the new boat. This is typical for a firm with large working capital or fixed asset needs. Brooks recalls a sustainable growth formula that his professor mentioned that related retained earnings and the return on earnings to growth. He grabbed his notes and found the sustainable growth formula shown in (3) below: g=bx ROE (3) where: = growth rate in earnings = earnings retention ratio, (1-dividend payout rate) = return on equity, Net Income / Equity ROE In order to sustain a growth rate of 30%, Rising Tide must retain most of its earnings. In this case 96%, (1-$0.10/$2.50). That equates to an approximate return on equity of 31.25%. Currently Rising Tide is a fast growing company, but what about the competition. Surely this type of return on equity will attract competition and before long earnings slow. The gradual reduction in sales and earnings growth places less capital reinvestment demands on the company. At that point the company may wish to return more money to shareholders in the form of increased dividends. Brooks notices that the long-term return on equity for many firms in this industry is very low, approximately 4-5%. He also knows that reinvestment is important to survive through continual research and development. He estimates that the long- term dividend payout ratio should be 30% and checks that using equation (3) above with a long-term growth rate of 3% and ROE of 4%. 3% = b x 4% b= 75% A retention rate of 75% implies a dividend payout of 25%. He feels like 30% is justified for the long-term and that his assumptions are reasonable and defensible when he presents his model to the Program Manager the next day. As before he needs to transition the dividend payout rate from the low rate now of 4% to the high rate later at 30%. Figure 2 shows the illustration. Returning to equation (1) we see the dividend payout in period 6 is 4% + (30%-4%)/5 = 9.2%. The dividend payout for 7 builds on this by adding to the 9.2%. This continues through year 10 when the firm attains a dividend payout rate of 30%. Brooks builds his model now with earnings growth slowing through the transition period and with dividend payout increasing through this time. This results in a much higher dividend due to the large increase in payout. Equation (2) is used to determine the dividend per share by multiplying earnings per share by the dividend payout rate. Earnings are growing at a slowing pace, but a larger portion of earnings are being returned to shareholders. These dividends form his cash flows for equity valuation. He now sets about calculating the discount factor for these cash flows to arrive at the firm's equity value. Case Study Series Figure 2. Dividend Payout for Rising Tide, Inc. Dividend Payout Low Payout in Years 1-5, Transition in Years 6-10, Higher Payout Phase 35.00% High Payout = 30% 30.00% 25.00% 20.00% Linear Transition to 30% 15.00% 10.00% Low Payout = 4% 5.00% 0.00% 1 2 3 4 5 6 7 8 9 10 11 12 13 14 15 Source: Author Discount Factor The intrinsic value of any asset is the present value of its future cash flows. In the case of Rising Tide, Brooks is assuming that dividends are the source of cash flows to investors. He calculates an equity discount factor (ke) for Rising Tide using the Capital Asset Pricing Model with key inputs of the risk-free rate, market risk premium and beta of Rising Tide with the market shown in Equation (4). Brooks uses a 4.0% historical Treasury rate for the risk- free rate and 6.0% as the historical market risk premium'. ke = Risk-free rate + beta (Market Risk Premium) There are a variety of methods for calculating beta. Brooks could find beta by regressing five years of weekly Rising Tide returns of the S&P 500. He could also use five years of monthly returns or two years of weekly returns. Each of these is a valid sample period. One well- known data source provides an "adjusted" beta which is determined by first calculating a "raw" beta by regressing two years of weekly security returns on the market. This is then adjusted by taking 2/3 of the raw beta plus 1/3 of one. This adjusts the beta to be closer to one, since beta is not stationary and should naturally move towards one through time as a firm expands. Brooks runs a regression of five years of stock returns for Rising Tide versus the S&P 500 using monthly observations and gets a beta of 1.6. Using (4) above the discount rate for Rising Tide is 4% + 1.6*6% or 13.6%. As mentioned earlier, Rising Tide is currently in a relatively high business risk environment. Brooks assumes that as the new boat design gains traction among fishermen and guides, the business risk will slow. He estimates that the beta will be 1.0 in the long-term and plans to see it transition over the period same period as earning growth and dividend payout. Figure 3 shows the expected change in discount rate through time. Using Equation 1, Brooks is able to show the declining discount rate. For instance, the year 6 discount rate should be 13.6% + (10%-13.6%)/5 or 12.88%. Years 7-10 follow as similar method until reaching 10% in year 10, determined by 4% + 1.0(6%) as beta becomes 1.0. The risk-free rate is determined based on the geometric average of the long-term Treasury. The market risk premium is calculated based on the difference between the geometric return on the Standard & Poor's 500 index and the long-term Treasury. ILLIUULIUKUILULUI LITUULUU ULIOPILULUI IJJI 222 UUDI Vol. IX Issue - 5 www.irjaf.com May, 2018 Case Study Series Figure 3. Discount Factor for Rising Tide, Inc. Discount Factor High Business Risk in Years 1-5, Transition in Years 6-10, Low Risk Phase High Risk = 13.6% 16.00% 14.00% 12.00% 10.00% Linear Transition to 10% Long-Term Risk = 10% 8.00% 6.00% 4.00% 2.00% 0.00% 1 2 3 4 5 6 7 8 9 10 11 12 13 14 15 Source: Author Valuation Process - Years 1-5 Now Brooks can begin the task of determining the present value of each of the dividends. For instance in year 1. He starts with earnings of $2.50 and let's these grow at a rate of 30%. This results in an earnings per share figure for year 1 of $3.25. He then takes a dividend payout of 4% to see dividends per share in year 1 of 4%*$3.25 or $0.13. Taking the present value of the year 1 dividend results in $0.13/(1+0.136)' or $0.1144. We see this illustrated in the Figure 4 below. Figure 4. Present Value of Year 1 Dividend for Rising Tide, Inc. Description/Year 0 1 Earnings growth rate 30.00% 30.00% Earnings per share (EPS) $ 2.50 $ 3.25 Dividend payout (DPS/EPS) L 4.00% 4.00% Dividends per share (DPS) 1 $ 0.10 $ 0.13 Cost of equity (Ke) 13.60% 13.60% Present value of cash flows $ 0.11 Source: Author Brooks continues this process to get the present value of all dividends during the fast growth years of 1-5 using a steady 30% growth rate of earnings, 4% dividend payout, and 13.6% cost of equity as the discount factor. He now has the present value of the next five years of dividends for Rising Tide. Valuation Process Years 6-10 At this point, the firm begins to transition to a new normal operating period with earnings growth declining, dividend payout increasing, and discount factor declining. He recalls that there is a different method for discounting during the transition period and stops to ensure he has his notes on that topic. He finds an example that illustrates the method for discounting VUI, TA TS5uCJ 114,2010 WWW.II .COM Case Study Series cash flows when the discount rate changes over time. The example from his notes are shown in Figure 5 below. Figure 5. Example of Discounting with Varying Discount Rates Time Period Dividend Discount Rate Present Value 1 $1.00 12% $0.89 2 $1.20 12% $0.96 3 $1.46 12% $1.04 4 $1.68 12% $1.07 5 $2.00 12% $1.13 6 $2.25 10% $1.16 o 1 Time Period S Discount Rate 2 12% 3 12% 4 12% 5 12% 6 10% 12% $1.16 $1.30 $1.46 $1.63 $1.83 $2.05 $2.25 Source: Author Cash flows are discounted by the discount factor prevailing at each discount period. For instance, as shown in Figure 5, the dividend in year 6 is discounted at each discount factor over the six-year span. With a $2.25 dividend in year, it is discounted once at 10% and then five times at 12% resulting in a present value of $1.16. This is shown mathematically, in Equations (5) and (6) below. PV of Divo = Div/ [(1+ki)'x (1+ke2)'x (1+kez)'x (1+ka)'x (1+ks)'x (1+keo)'] (5) PV of Dive = Divo/((1+kel) x (1+keo)'] (6) Relating this to Rising Tide, Brooks takes his calculated dividend for year six and discounts this as the product of the discount factors over periods one through five and the discount factor for year six using Equation (6). He then continues with dividends seven through 10 in a similar process adding an additional term in Equation (6) for each next discount factor and ensuring that the sum of his exponents is equivalent to the cash flow period in question. He now has the present value of the dividends in years 6-10 for Rising Tide. Valuation Process Terminal Value His final task is to gather the terminal value for Rising Tide using a constant growth dividend discount approach. At the conclusion of year 10 we note that Rising Tide will have a constant earnings growth of 3%, a constant dividend payout of 30%, and a constant discount factor of 10%. Brooks can now employ the constant growth formula shown in Equation (7) to find the terminal value of Rising Tide over the period from year 10 through infinity. He'll next need to discount this terminal value to find the present value just as he did with the prior dividends by using the discount factors for prevailing at each discount period. He recalls that this discount factor for the terminal value should be the same as the discount factor used for the dividend in year 10. Value of Equity10 = EPS11 X (dividend payout 1) / [kell - EPS growth ] (7) age 7 Merilaulural ResearCII JUUMINI UI APpileu Finance ISSN 2229-6891 Vol. IX Issue - 5 May, 2018 www.irjaf.com Case Study Series He now has the present value of dividends one through five, six through 10, and 10 to infinity which match his three time periods. He takes the sum of these three present values to provide his estimate of the firm's equity value. This methodology is illustrated in Figure 6. Figure 6. Illustration of the Three-Stage Dividend Discount Model Fast Growth Period 2 3 4 Div 2 Div 3 Div 4 Time Period Transition Period Terminal Period ... 6 1 Div 1 + 5 Div 2 3 Div 5 Div 5 6 Div 6 7 Div 7 8 Div 8 9 Div 9 10 Div 10 PV Div 1 Present Value PV Div 2 of Fast PV Div 3 Growth Period PV Div 4 PV Div 5 PV Div 6 Present Value of PV Div 7 Transition Period PV Div 8 PV Div 9 PV Div 10 V10 =D11/(ke-g) Present Value of Terminal Value JPV of V10 + Equity Value Source: Author Knowing the model is dependent on his assumptions, he double checks his work to ensure his inputs are both reasonable and defensible and prepares a document to highlight his work for the next day's meeting with his Program Manager. Specific Questions: 1. Using the information provided in the case and the template provided, what are your earnings forecasts over the ten-year period which includes a fast growth period and a transition period to constant growth? 2. What are the dividends over the ten-year period using the earnings from question 1 and your forecast of dividend payout? 3. What discount factors do you use for each of the discount periods? 4. What are the present values of each dividend over the first five years (Fast Growth Period) and years six through 10 (Transition Period)? 5. What is the terminal value of Rising Tide, Inc. in year 10 using the constant growth formula? 6. What is the present value of the terminal price? 7. Using the present values of dividends in years one through 10 and the present value of terminal price, what is the value of Rising Tide, Inc. stock? 8. What words of advice would you give to Brooks as he prepares for the meeting with his Program Manager the next day? JUUSULW.ICUSCI Abstract Brooks Hamilton recently completed his third year in college and has just started a summer internship at a prestigious Wall Street investment firm. The investment firm is very selective in hiring interns, but even more selective in extending full-time employment offers to students upon completion of their last year of studies. Brooks is eager to make a good impression at work and wants to be one of the few selected to join the firm after his last year in college. The Program Manager for the interns gives each a time-sensitive assignment to value a fast-growing company's stock. Each intern is given one day to complete the assignment. Brooks decides to use a three-stage dividend discount model to provide for fast growth, transition, and a slower terminal growth period. Keywords: Three-Stage Model, H Model, Dividend Discount Model, Valuing Growth JEL Code: G11, G32, G35 Introduction Brooks Hamilton is a college student who has just begun a summer investment banking internship with a prestigious Wall Street firm. He is one of 50 students who were fortunate to land an internship to work with the firm during the summer before their last year in college. The firm is highly selective and accepted these 50 interns from over 700 applicants. Brooks is excited about the work he'll do during the summer and he knows that the top ten interns will likely receive full-time job offers to join the firm upon the completion of their last year in college. He wants to learn a lot during the summer and plans to make his best effort to secure a full-time job offer by the end of summer. The firm's program manager has just presented each intern with a challenge. She assigns each intern a company and states that each must value the company's equity and expects to see their valuation and supporting model the next morning. Brooks has been assigned a company called Rising Tide, Inc. He is starting with a blank spreadsheet. It's time to get busy. The Company Rising Tide Inc. has been in business for the past 20 years as a builder of fine fishing boats. The company began as a collaboration between a top boat designer and a legendary fishing guide. Rising Tide has modified its designs over the past two decades with an emphasis on continuous improvement and has recently launched an exciting new shallow water boat that is predicted to become the industry leader. The shallow water boat industry has many manufacturers. Most of the large boat builders have a range of boats that they manufacture from freshwater to saltwater, deep sea to shallow, sports boats to pleasure craft. Rising Tide decided to focus solely on shallow water sports fishing boats for saltwater fish species and has worked with professional guides, who depend on boat performance and reliability for their livelihood, to create a new boat. The launch has been well-received and customers have willingly paid the premium price of $62,500 that Rising Tide charges for this boat. Industry and Economic Analysis Brooks gathers financial information on Rising Tide and begins reading about the sports fishing boat manufacturing industry. He discovers that, as with many industries, new design launches provide a nice initial increase in sales, but slowly the competition catches up with Page 1 Case Study Series their own designs to capture market share. It is estimated that the time advantage for new design launches is approximately five years. During this period sales growth can be very strong and it is not uncommon to see sales and earnings growth rates of 30-40% per year or more. In order to sustain its design advantage, firms tend to reinvest heavily in new product research and development and therefore pay only a modest dividend to shareholders. This is also the period of time when firms tend to have the most business risk since the company is so dependent on this specialized product which has limited customers. Brooks notices that Rising Tide follows economic cycles, reporting strong financial results during economic expansions and suffering disappointing results during economic downturns. Although the number of people who participate in sports fishing has increased over the years, the high cost to charter a boat and guide for a day of fishing creates a relatively limited clientele! Given current economic forecasts for continued expansion and the success of the newest design by Rising Tide, Brooks decides to use a model which can accommodate fast growth in the upcoming years that will gradually decline as competition gains market share. He recalls such a model from his investments class at university and starts gathering the necessary inputs. Three-Stage Dividend Discount Model Brooks believes that the three-stage dividend discount model is ideal for this company. This model allows for varying growth rates and can accommodate adjustments to dividend payout and discount factors from changing business risk. The flexibility of the model allows it to be used to value a variety of firm types and it is ideally suited to value firms that are currently experiencing abnormally fast growth rates but will eventually lose this current competitive advantage. He gathers financial information for his main value drivers. He believes the drivers for Rising Tide share value are earnings growth, dividend payout, and the discount rate. The value of Rising Tide's equity is determined by taking the present value of the dividends. There are three stages to consider for this valuation exercise; the fast growth period in years 1-5, the transition phase in years 6-10, and the constant growth phase for years 11 to infinity. Brooks has his plan in place and starts building his model. Earnings Growth He believes that earnings will grow with sales over the next five years at very high rates then gradually decline and ultimately reach a lower constant growth rate as Rising Tide loses its competitive advantage. Figure 1 illustrates the view that Brooks has for earnings growth at Rising Tide. Over the next five years the firm will enjoy limited competition and will experience substantial earnings growth. After viewing past successful product launches in the industry, Brooks believes that Rising Tide can generate earnings growth of 30% per year over each of the next five years. In the most recent financial year, Rising Tide reported earnings per share of $2.50. Brooks sees that figure compounding to $9.28 per share by the end of the five year period? With the entrance of new designs from competitors, Brooks believes that sales and earnings growth will decline. He expects to see a gradual reduction of earnings growth over years six The U.S. Department of Interior reports that the most recent five-year survey by the U.S. Fish and Wildlife Service showed that 101.6 million Americans, 40 percent of the U.S. population 16 years old and older, participated in wildlife-related activities in 2016. Almost 36 million engaged in fishing and overall expenditures increased by 8% from the prior survey. Source: U.S. Department of Interior. age 2 VUI, 21 ISSUC J 142010 WWW.11J.COM Case Study Series through ten until Rising Tide reaches a constant growth rate of three percent, which follows the expected long-term growth rate for this industry. Figures Figure 1. Earnings Growth for Rising Tide, Inc. Earnings Growth High Growth in Years 1-5, Transition in Years 6-10, Infinite Growth Phase 35.00% High Growth = 30% 30.00% 25.00% 20.00% 15.00% Linear Transition to 3% 10.00% 5.00% Infinite Growth = 3% 0.00% 1 2 3 4 5 6 7 8 9 10 11 12 13 14 15 Source: Author He plans to use 30% earnings growth for each of the next five years and then allow this to linearly decline to 3% over the subsequent five years in a straight line reduction. The formula he uses for the linear transition periods is: Value, = Value-1 + [(target value - high growth value)] where: Value Valuet-1 target value high growth value = the value at t = the value at time t-1 = the long-term value we expect after the transition = the value during the high growth phase = number of transition periods For instance, if you observe a company with earnings growth at 30% and you want to see it transition to 3% over a five-year period then you would calculate each of the transition periods using (1) above. For Period 6, the result would be: Value = Values + [(3% - 30%)/5] With the value at time 5 of 30%, the value at time 6 becomes 30% - 5.4% or 24.6%. For time period 7 you simply subtract 5.4% from 24.6% and so on. This terminates at time period 10 when you reach the target value of 3% earnings growth in the infinite growth period. Dividend Payout Brooks sees that Rising Tide is currently paying a dividend of $0.10 per share on earnings of $2.50 per share. The dividend payout ratio is shown in (2) below: Uul Uluay UCITUD Dividend payout = dividends per share / earnings per share Therefore, Rising Tide currently has a dividend payout of $0.10/$2.50 or 4%. Brooks thinks that is a very low figure, but then sees that the firm is putting a lot of money back into the firm to keep up with production demands for the new boat. This is typical for a firm with large working capital or fixed asset needs. Brooks recalls a sustainable growth formula that his professor mentioned that related retained earnings and the return on earnings to growth. He grabbed his notes and found the sustainable growth formula shown in (3) below: g=bx ROE (3) where: = growth rate in earnings = earnings retention ratio, (1-dividend payout rate) = return on equity, Net Income / Equity ROE In order to sustain a growth rate of 30%, Rising Tide must retain most of its earnings. In this case 96%, (1-$0.10/$2.50). That equates to an approximate return on equity of 31.25%. Currently Rising Tide is a fast growing company, but what about the competition. Surely this type of return on equity will attract competition and before long earnings slow. The gradual reduction in sales and earnings growth places less capital reinvestment demands on the company. At that point the company may wish to return more money to shareholders in the form of increased dividends. Brooks notices that the long-term return on equity for many firms in this industry is very low, approximately 4-5%. He also knows that reinvestment is important to survive through continual research and development. He estimates that the long- term dividend payout ratio should be 30% and checks that using equation (3) above with a long-term growth rate of 3% and ROE of 4%. 3% = b x 4% b= 75% A retention rate of 75% implies a dividend payout of 25%. He feels like 30% is justified for the long-term and that his assumptions are reasonable and defensible when he presents his model to the Program Manager the next day. As before he needs to transition the dividend payout rate from the low rate now of 4% to the high rate later at 30%. Figure 2 shows the illustration. Returning to equation (1) we see the dividend payout in period 6 is 4% + (30%-4%)/5 = 9.2%. The dividend payout for 7 builds on this by adding to the 9.2%. This continues through year 10 when the firm attains a dividend payout rate of 30%. Brooks builds his model now with earnings growth slowing through the transition period and with dividend payout increasing through this time. This results in a much higher dividend due to the large increase in payout. Equation (2) is used to determine the dividend per share by multiplying earnings per share by the dividend payout rate. Earnings are growing at a slowing pace, but a larger portion of earnings are being returned to shareholders. These dividends form his cash flows for equity valuation. He now sets about calculating the discount factor for these cash flows to arrive at the firm's equity value. Case Study Series Figure 2. Dividend Payout for Rising Tide, Inc. Dividend Payout Low Payout in Years 1-5, Transition in Years 6-10, Higher Payout Phase 35.00% High Payout = 30% 30.00% 25.00% 20.00% Linear Transition to 30% 15.00% 10.00% Low Payout = 4% 5.00% 0.00% 1 2 3 4 5 6 7 8 9 10 11 12 13 14 15 Source: Author Discount Factor The intrinsic value of any asset is the present value of its future cash flows. In the case of Rising Tide, Brooks is assuming that dividends are the source of cash flows to investors. He calculates an equity discount factor (ke) for Rising Tide using the Capital Asset Pricing Model with key inputs of the risk-free rate, market risk premium and beta of Rising Tide with the market shown in Equation (4). Brooks uses a 4.0% historical Treasury rate for the risk- free rate and 6.0% as the historical market risk premium'. ke = Risk-free rate + beta (Market Risk Premium) There are a variety of methods for calculating beta. Brooks could find beta by regressing five years of weekly Rising Tide returns of the S&P 500. He could also use five years of monthly returns or two years of weekly returns. Each of these is a valid sample period. One well- known data source provides an "adjusted" beta which is determined by first calculating a "raw" beta by regressing two years of weekly security returns on the market. This is then adjusted by taking 2/3 of the raw beta plus 1/3 of one. This adjusts the beta to be closer to one, since beta is not stationary and should naturally move towards one through time as a firm expands. Brooks runs a regression of five years of stock returns for Rising Tide versus the S&P 500 using monthly observations and gets a beta of 1.6. Using (4) above the discount rate for Rising Tide is 4% + 1.6*6% or 13.6%. As mentioned earlier, Rising Tide is currently in a relatively high business risk environment. Brooks assumes that as the new boat design gains traction among fishermen and guides, the business risk will slow. He estimates that the beta will be 1.0 in the long-term and plans to see it transition over the period same period as earning growth and dividend payout. Figure 3 shows the expected change in discount rate through time. Using Equation 1, Brooks is able to show the declining discount rate. For instance, the year 6 discount rate should be 13.6% + (10%-13.6%)/5 or 12.88%. Years 7-10 follow as similar method until reaching 10% in year 10, determined by 4% + 1.0(6%) as beta becomes 1.0. The risk-free rate is determined based on the geometric average of the long-term Treasury. The market risk premium is calculated based on the difference between the geometric return on the Standard & Poor's 500 index and the long-term Treasury. ILLIUULIUKUILULUI LITUULUU ULIOPILULUI IJJI 222 UUDI Vol. IX Issue - 5 www.irjaf.com May, 2018 Case Study Series Figure 3. Discount Factor for Rising Tide, Inc. Discount Factor High Business Risk in Years 1-5, Transition in Years 6-10, Low Risk Phase High Risk = 13.6% 16.00% 14.00% 12.00% 10.00% Linear Transition to 10% Long-Term Risk = 10% 8.00% 6.00% 4.00% 2.00% 0.00% 1 2 3 4 5 6 7 8 9 10 11 12 13 14 15 Source: Author Valuation Process - Years 1-5 Now Brooks can begin the task of determining the present value of each of the dividends. For instance in year 1. He starts with earnings of $2.50 and let's these grow at a rate of 30%. This results in an earnings per share figure for year 1 of $3.25. He then takes a dividend payout of 4% to see dividends per share in year 1 of 4%*$3.25 or $0.13. Taking the present value of the year 1 dividend results in $0.13/(1+0.136)' or $0.1144. We see this illustrated in the Figure 4 below. Figure 4. Present Value of Year 1 Dividend for Rising Tide, Inc. Description/Year 0 1 Earnings growth rate 30.00% 30.00% Earnings per share (EPS) $ 2.50 $ 3.25 Dividend payout (DPS/EPS) L 4.00% 4.00% Dividends per share (DPS) 1 $ 0.10 $ 0.13 Cost of equity (Ke) 13.60% 13.60% Present value of cash flows $ 0.11 Source: Author Brooks continues this process to get the present value of all dividends during the fast growth years of 1-5 using a steady 30% growth rate of earnings, 4% dividend payout, and 13.6% cost of equity as the discount factor. He now has the present value of the next five years of dividends for Rising Tide. Valuation Process Years 6-10 At this point, the firm begins to transition to a new normal operating period with earnings growth declining, dividend payout increasing, and discount factor declining. He recalls that there is a different method for discounting during the transition period and stops to ensure he has his notes on that topic. He finds an example that illustrates the method for discounting VUI, TA TS5uCJ 114,2010 WWW.II .COM Case Study Series cash flows when the discount rate changes over time. The example from his notes are shown in Figure 5 below. Figure 5. Example of Discounting with Varying Discount Rates Time Period Dividend Discount Rate Present Value 1 $1.00 12% $0.89 2 $1.20 12% $0.96 3 $1.46 12% $1.04 4 $1.68 12% $1.07 5 $2.00 12% $1.13 6 $2.25 10% $1.16 o 1 Time Period S Discount Rate 2 12% 3 12% 4 12% 5 12% 6 10% 12% $1.16 $1.30 $1.46 $1.63 $1.83 $2.05 $2.25 Source: Author Cash flows are discounted by the discount factor prevailing at each discount period. For instance, as shown in Figure 5, the dividend in year 6 is discounted at each discount factor over the six-year span. With a $2.25 dividend in year, it is discounted once at 10% and then five times at 12% resulting in a present value of $1.16. This is shown mathematically, in Equations (5) and (6) below. PV of Divo = Div/ [(1+ki)'x (1+ke2)'x (1+kez)'x (1+ka)'x (1+ks)'x (1+keo)'] (5) PV of Dive = Divo/((1+kel) x (1+keo)'] (6) Relating this to Rising Tide, Brooks takes his calculated dividend for year six and discounts this as the product of the discount factors over periods one through five and the discount factor for year six using Equation (6). He then continues with dividends seven through 10 in a similar process adding an additional term in Equation (6) for each next discount factor and ensuring that the sum of his exponents is equivalent to the cash flow period in question. He now has the present value of the dividends in years 6-10 for Rising Tide. Valuation Process Terminal Value His final task is to gather the terminal value for Rising Tide using a constant growth dividend discount approach. At the conclusion of year 10 we note that Rising Tide will have a constant earnings growth of 3%, a constant dividend payout of 30%, and a constant discount factor of 10%. Brooks can now employ the constant growth formula shown in Equation (7) to find the terminal value of Rising Tide over the period from year 10 through infinity. He'll next need to discount this terminal value to find the present value just as he did with the prior dividends by using the discount factors for prevailing at each discount period. He recalls that this discount factor for the terminal value should be the same as the discount factor used for the dividend in year 10. Value of Equity10 = EPS11 X (dividend payout 1) / [kell - EPS growth ] (7) age 7 Merilaulural ResearCII JUUMINI UI APpileu Finance ISSN 2229-6891 Vol. IX Issue - 5 May, 2018 www.irjaf.com Case Study Series He now has the present value of dividends one through five, six through 10, and 10 to infinity which match his three time periods. He takes the sum of these three present values to provide his estimate of the firm's equity value. This methodology is illustrated in Figure 6. Figure 6. Illustration of the Three-Stage Dividend Discount Model Fast Growth Period 2 3 4 Div 2 Div 3 Div 4 Time Period Transition Period Terminal Period ... 6 1 Div 1 + 5 Div 2 3 Div 5 Div 5 6 Div 6 7 Div 7 8 Div 8 9 Div 9 10 Div 10 PV Div 1 Present Value PV Div 2 of Fast PV Div 3 Growth Period PV Div 4 PV Div 5 PV Div 6 Present Value of PV Div 7 Transition Period PV Div 8 PV Div 9 PV Div 10 V10 =D11/(ke-g) Present Value of Terminal Value JPV of V10 + Equity Value Source: Author Knowing the model is dependent on his assumptions, he double checks his work to ensure his inputs are both reasonable and defensible and prepares a document to highlight his work for the next day's meeting with his Program Manager. Specific Questions: 1. Using the information provided in the case and the template provided, what are your earnings forecasts over the ten-year period which includes a fast growth period and a transition period to constant growth? 2. What are the dividends over the ten-year period using the earnings from question 1 and your forecast of dividend payout? 3. What discount factors do you use for each of the discount periods? 4. What are the present values of each dividend over the first five years (Fast Growth Period) and years six through 10 (Transition Period)? 5. What is the terminal value of Rising Tide, Inc. in year 10 using the constant growth formula? 6. What is the present value of the terminal price? 7. Using the present values of dividends in years one through 10 and the present value of terminal price, what is the value of Rising Tide, Inc. stock? 8. What words of advice would you give to Brooks as he prepares for the meeting with his Program Manager the next day
Step by Step Solution

There are 3 Steps involved in it

Step: 1

blur-text-image

Get Instant Access to Expert-Tailored Solutions

See step-by-step solutions with expert insights and AI powered tools for academic success

Step: 2

blur-text-image

Step: 3

blur-text-image

Ace Your Homework with AI

Get the answers you need in no time with our AI-driven, step-by-step assistance

Get Started

Recommended Textbook for

More Books

Students also viewed these Accounting questions

Question

Are there any questions that you want to ask?

Answered: 1 week ago