

Answered step by step
Verified Expert Solution
Question
1 Approved Answer
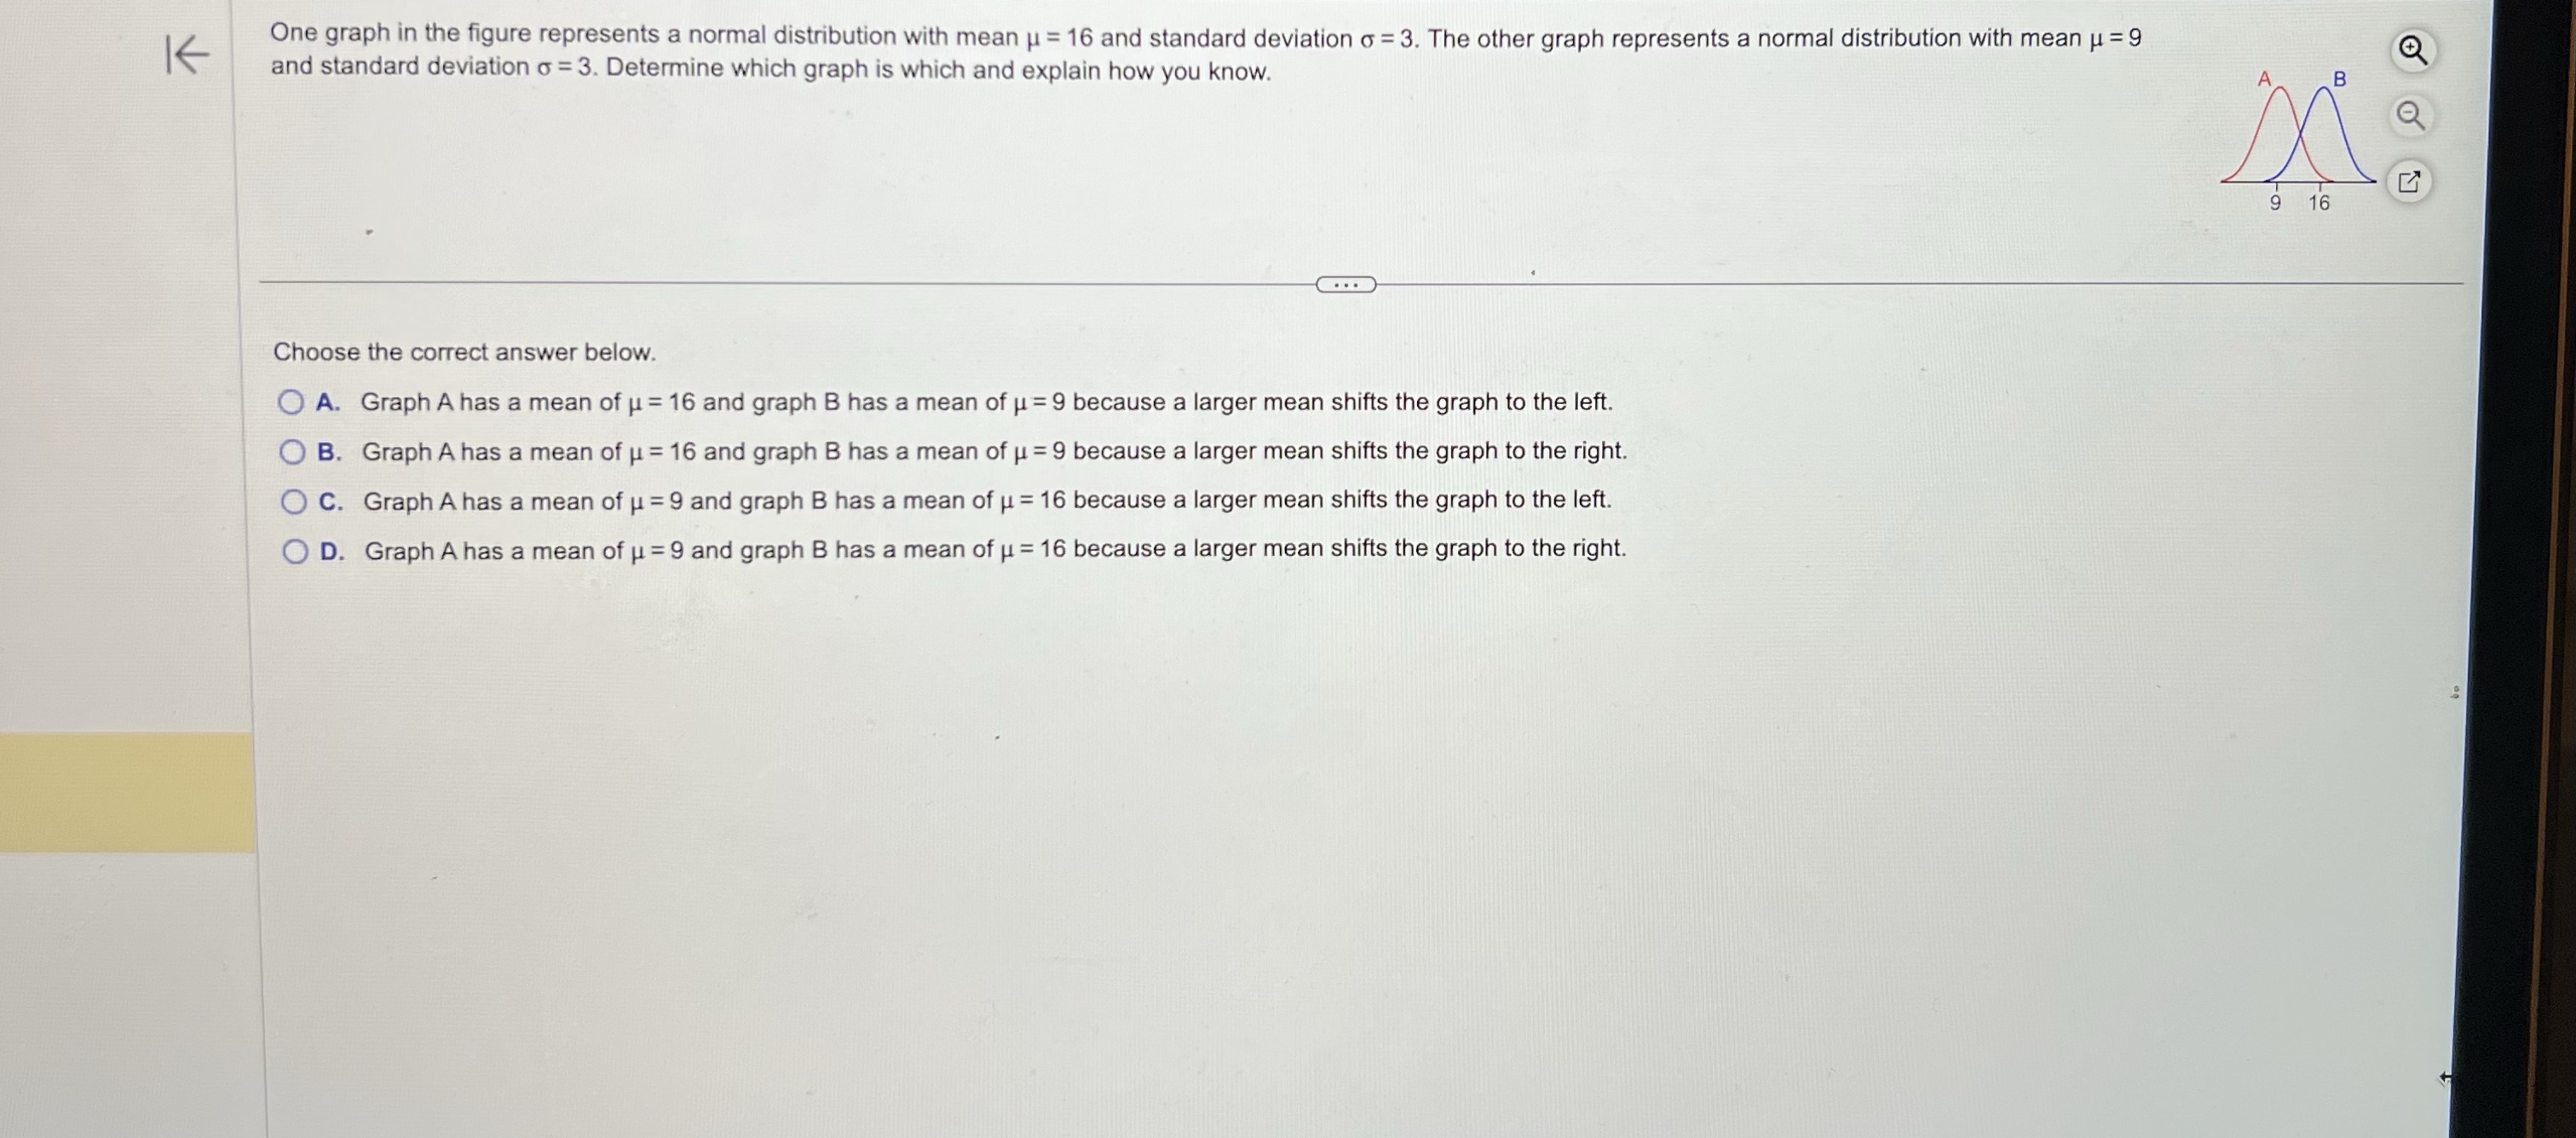
K One graph in the figure represents a normal distribution with mean u = 16 and standard deviation o = 3. The other graph represents
Step by Step Solution
There are 3 Steps involved in it
Step: 1

Get Instant Access to Expert-Tailored Solutions
See step-by-step solutions with expert insights and AI powered tools for academic success
Step: 2

Step: 3
Ace Your Homework with AI
Get the answers you need in no time with our AI-driven, step-by-step assistance
Get Started
Algebra Math 1st Grade Workbook
Authors: Jerome Heuze
1st Edition
979-8534507850