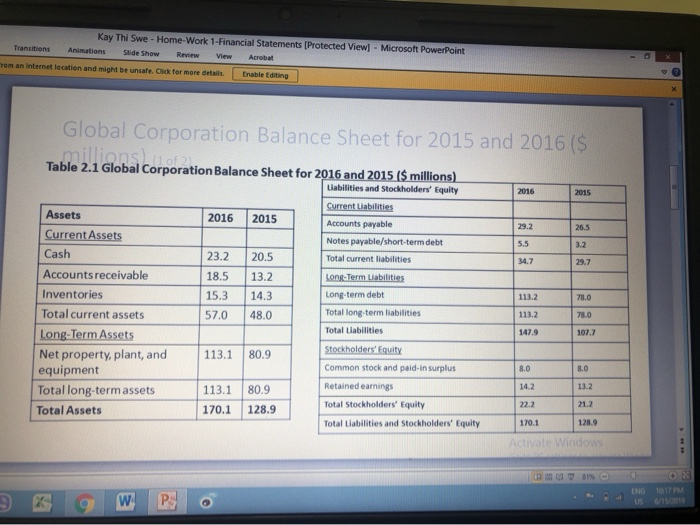
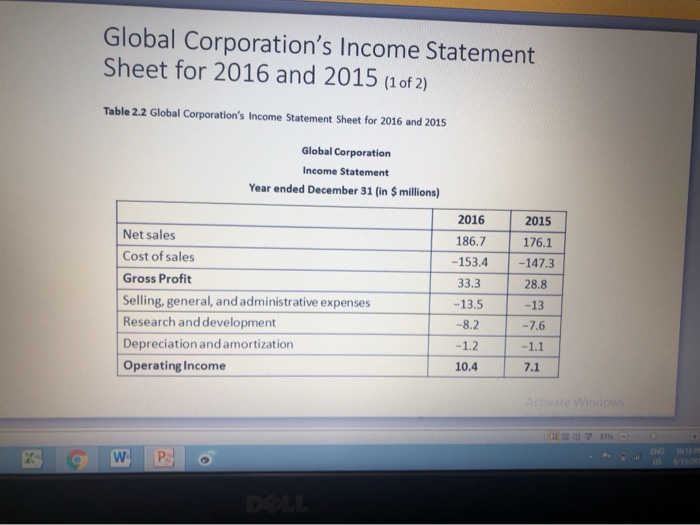
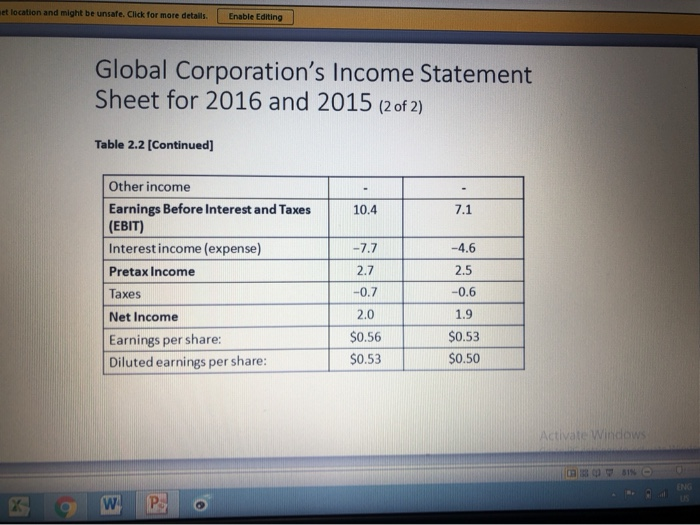
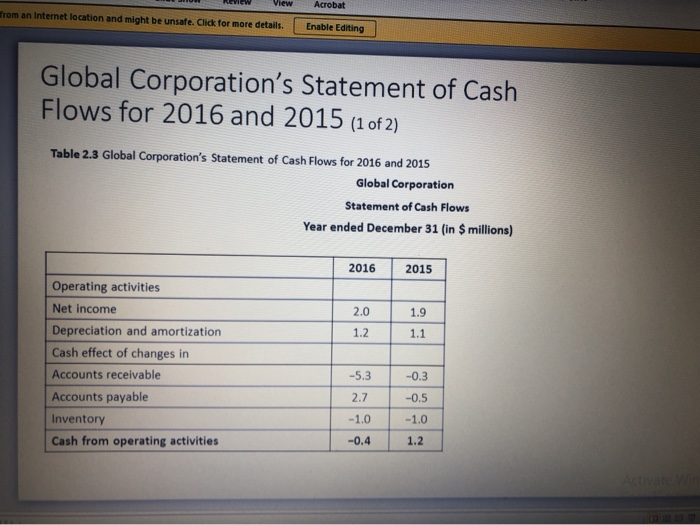
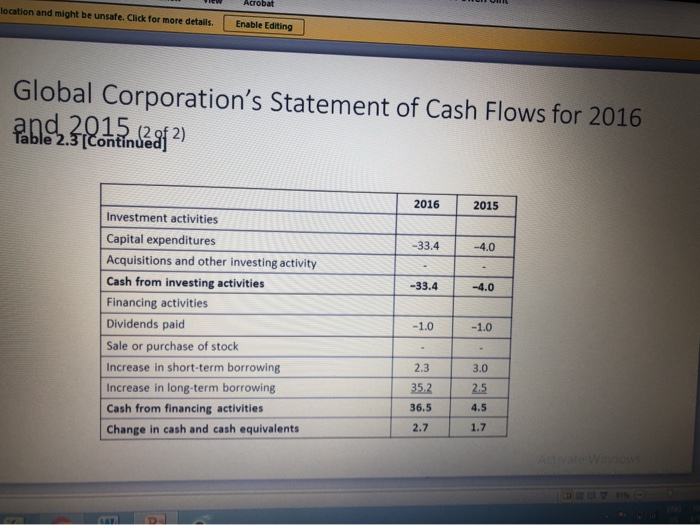
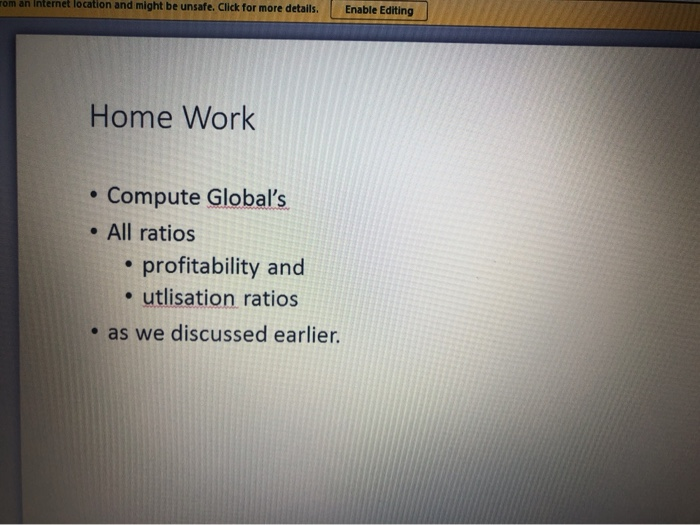
Kay Thi Swe - Home-Work 1-Financial Statements [Protected View)- Microsoft PowerPoint Transitions Animations Slide Show Review View Acrobat rom an Internet location and might be unsafe. Cick for more details tnable Editing Global Corporation Balance Sheet for 2015 and 2016 ($ millionsno 2. Table 2.1 Global Corporation Balance Sheet for 2016 and 2015 ($ millions) Liabilities and Stockholders' Equity 2016 2015 Current Liabilities Assets 2016 2015 Accounts payable 29.2 26.5 CurrentAssets Notes payable/short-term debt 5.5 3.2 Cash 23.2 20.5 Total current liabilities 34.7 29.7 Accounts receivable Long-Term Liabilities 18.5 13.2 Inventories 15.3 14.3 Long-term debt 113.2 78.0 Total current assets Total long-term liabilities 57.0 48.0 113.2 78.0 Long-Term Assets Net property, plant, and equipment Total long-term assets Total Liabilities 147.9 107.7 Stockholders' Equity 113.1 80.9 Common stock and paid-in surplus 8.0 8.0 Retained earnings 14.2 13.2 113.1 80.9 Total Stockholders' Equity 22.2 21.2 Total Assets 170.1 128.9 Total Liabilities and Stockholders' Equity 170.1 128.9 Activate Windows 1017 PM ENG 9K W 6/15/2019 US Global Corporation's Income Statement Sheet for 2016 and 2015 (1of 2) Table 2.2 Global Corporation's Income Statement Sheet for 2016 and 2015 Global Corporation Income Statement Year ended December 31 (in $ millions) 2016 2015 Net sales 186.7 176.1 Cost of sales -153.4 -147.3 Gross Profit 33.3 28.8 Selling, general, and administrative expenses -13.5 -13 Research and development -8.2 -7.6 Depreciation and amortization -1.2 -1.1 Operating Income 10.4 7.1 Activate Windows ENG 1018 PM Us 6/15/20 W et location and might be unsafe. Click for more details. Enable Editing Global Corporation's Income Statement Sheet for 2016 and 2015 (2 of 2) Table 2.2 [Continued] Other income Earnings Before Interest and Taxes (EBIT) Interest income (expense 10.4 7.1 -7.7 -4,6 2.7 2.5 Pretax Income -0.7 -0.6 Taxes 2.0 1.9 Net Income Earnings per share: Diluted earnings per share: $0.53 $0.56 $0.50 $0.53 Activate Windows ENG W US View Acrobat from an Internet location and might be unsafe. Click for more details Enable Editing Global Corporation's Statement of Cash Flows for 2016 and 2015 (1 of 2) Table 2.3 Global Corporation's Statement of Cash Flows for 2016 and 2015 Global Corporation Statement of Cash Flows Year ended December 31 (in $ millions) 2016 2015 Operating activities Net income 2.0 1.9 Depreciation and amortization 1.2 1.1 Cash effect of changes in Accounts receivable Accounts payable -5.3 -0.3 2.7 -0.5 Inventory Cash from operating activities -1.0 -1.0 -0.4 1.2 Activate W 0 Acrobat location and might be unsafe. Click for more details. Enable Editing Global Corporation's Statement of Cash Flows for 2016 And 2015(2gf 2) 2016 2015 Investment activities Capital expenditures -33.4 -4.0 Acquisitions and other investing activity Cash from investing activities -33.4 -4.0 Financing activities Dividends paid -1.0 -1.0 Sale or purchase of stock Increase in short-term borrowing 2.3 3.0 Increase in long-term borrowing 35.2 2.5 36.5 Cash from financing activities 4.5 2.7 1.7 Change in cash and cash equivalents Activate Windows rom an Internet location and might be unsafe. Click for more details. Enable Editing Home Work Compute Global's All ratios profitability and utlisation ratios as we discussed earlier
