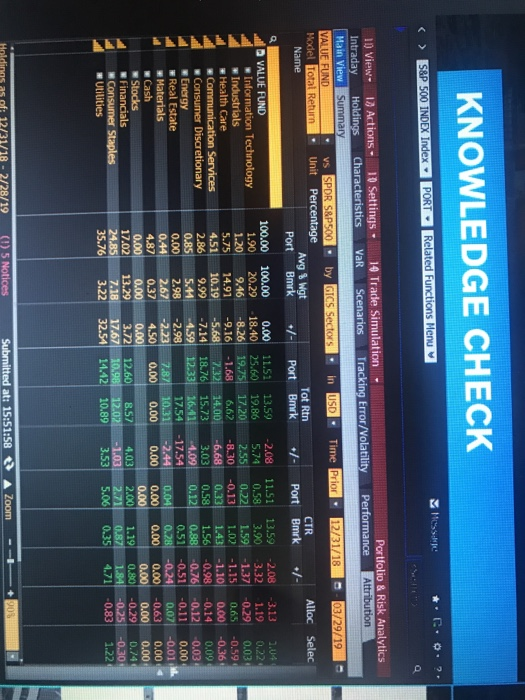
KNOWLEDGE CHECK You are analyzing your portfolio after the first quarter of 2019 to examine the reasons behind its change in performance since 2018. Based on the below table alone, what conclusion can you draw about your portfolio? Your portfolio is performing about 2% worse than the benchmark. You picked the wrong sectors but the right stocks in those sectors. Your portfolio is performing about 2% worse than the benchmark. You picked the right sectors but the wrong stocks in those sectors Your portfolio is performing about 2% better than the benchmark You picked the wrong sectors but the right stocks in those sectors Your portfolio is performing about 2% better than the benchmark You picked the right sectors but the wrong stocks in those sectors Click to open/close chart S&P 500 INDEX Index PORT Related Functions Menu 10 Settings Characteristics 10 Trade Simulation VaR Scenarios Tracking Error/Volatility Portfolio & Risk Analytics Performance Attribution 10 View 10 Actions Intraday Holdings Main View Summary VALUE FUND Model Total Return Name in USD. Time Prior. 12/31/18 - 03/29/19- vs SPOR SAP500. by GICS Sectors Unit Percentage Avg Wgt Port Bmrk Alloc Selec Tot Rtn Bmrk Port +/- Port Bmrk +/- 1.04 100.00 1.90 1.20 5.75 100.00 20.29 9.46 14.91 -2.08 5.74 2.55 0.00 18.40 -8.26 -9.16 -5.68 -7.14 4.59 11.51 13.59 0.58 3.90 0.221.59 1-02 0.331.43 0.58 1.56 4.51 11.51 13.59 25.60 19.86 19.75 17.20 -1.68 6.62 7.32 14.00 18.76 15.73 12.33 16.41 17.54 7.3710031 0.00 0.00 VALUE FUND Information Technology Industrials Health Care Communication Services Consumer Discretionary Energy Real Estate Materials Cash Stocks Financials Consumer Staples #Utilities 9.99 -2.08 3.32 -1.37 -1.15 -1.10 -0.98 -0.76 -0.51 -0.24 0.00 -6.68 3.03 4.09 -17.54 -2.44 0.00 -3.13 1.19 0.29 0.05 0.00 0.14 0.12 -0.11 0.07 -0.63 0.00 -0.29 -0.25 0.83 0.00 0.034 -0.594 -0,36 0.09 -0.03 0.00 -0.01 0.00 0.00 0.74 -0.30 1.22 0.44 0.00 4.87 0.00 17.02 24.85 35.76 0.80 13.29 7.18 3.22 12.60 10.98 14.42 8.57 12.02 10.89 4.03 -1.03 3.53 4.71 Holdings as of: 12/31/18 - 2/28/19 Submitted at: 15:51:58 5 Notices A Zoom +905