

Answered step by step
Verified Expert Solution
Question
1 Approved Answer
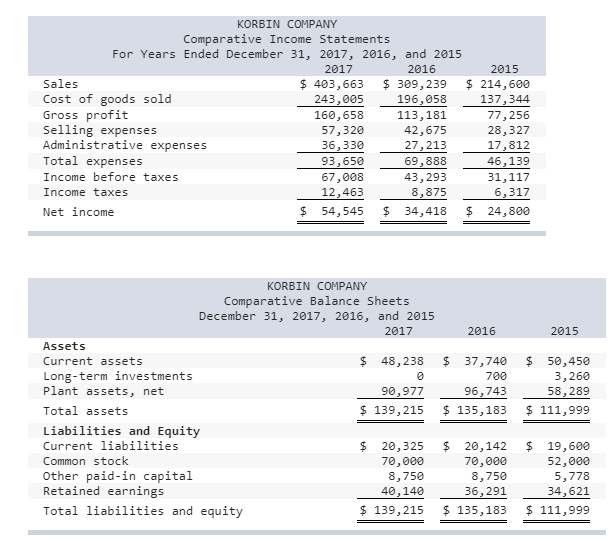
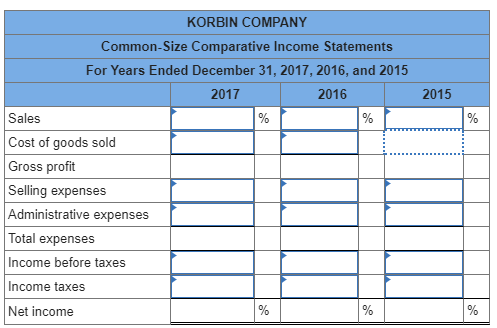
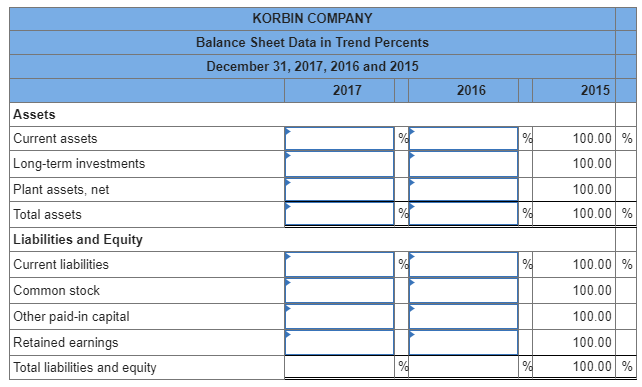
KORBIN COMPANY Comparative Income Statements For Years Ended December 31, 2017, 2016, and 2015 2017 2016 2015 Sales Cost of goods sold Gross profit Selling
Step by Step Solution
There are 3 Steps involved in it
Step: 1

Get Instant Access to Expert-Tailored Solutions
See step-by-step solutions with expert insights and AI powered tools for academic success
Step: 2

Step: 3
Ace Your Homework with AI
Get the answers you need in no time with our AI-driven, step-by-step assistance
Get Started
Information Technology And Insights Audit Controls Bringing A Vision And Understanding To Effective Practices
Authors: R. Allen Conner
1st Edition
1720081883, 978-1720081883