Answered step by step
Verified Expert Solution
Question
1 Approved Answer
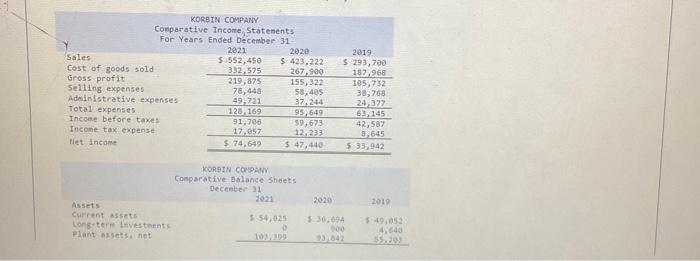
KORBIN COMPANY Comparative Income Statements For Years Ended December 31 Sales Cost of goods sold Gross profit Selling expenses Administrative expenses Total expenses Income before
KORBIN COMPANY Comparative Income Statements For Years Ended December 31 Sales Cost of goods sold Gross profit Selling expenses Administrative expenses Total expenses Income before taxes Income tax expense Net income Assets Current assets Long-term investments Plant assets, net 2021 $-552,450 332,575 219,875 78,448 49,721 128,169 91,706 17,057 $ 74,649 2020 $ 423,222 267,900 155,322 58,405 37,244 95,649 59,673 12, 233 $ 47,440 KORBIN COMPANY Comparative Balance Sheets December 31 2021 $ 54,825 103,399 2020 2019 $ 293,700 187,968 105,732 38,768 24,377 $36,694 93,842 63,145 42,587 8,645 $ 33,942 2019 $ 49,052 4,640 55,203

Step by Step Solution
There are 3 Steps involved in it
Step: 1

Get Instant Access to Expert-Tailored Solutions
See step-by-step solutions with expert insights and AI powered tools for academic success
Step: 2

Step: 3

Ace Your Homework with AI
Get the answers you need in no time with our AI-driven, step-by-step assistance
Get Started


